
Mathematics, 26.10.2021 14:30 mohayon2020
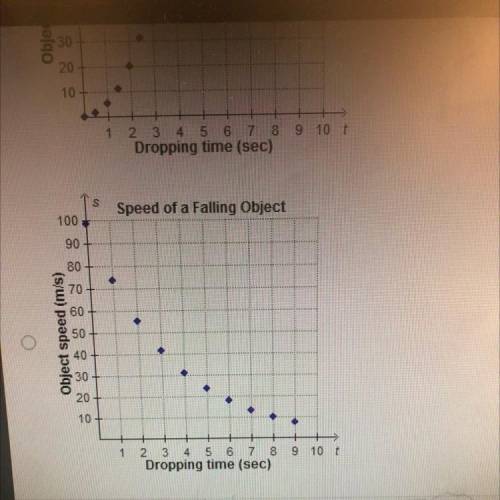
The speed of a falling object increases at a constant rate as time increases since the object was dropped Which
graph could represent the relationship between t time in seconds and s, speed in meters per second?
Speed of a Falling Object
100
90
80
70
60
Object speed (m/s)
20
10
9 10
8
Dropping time (sec)
.
Speed of a Falling Object
100
90
Mark this and return
NEX

Answers: 2


Another question on Mathematics
Mathematics, 21.06.2019 20:00
Question 3 (essay worth 10 points) (03.06 mc) part a: max rented a motorbike at $465 for 5 days. if he rents the same motorbike for a week, he has to pay a total rent of $625. write an equation in the standard form to represent the total rent (y) that max has to pay for renting the motorbike for x days. (4 points) part b: write the equation obtained in part a using function notation. (2 points) part c: describe the steps to graph the equation obtained above on the coordinate axes. mention the labels on the axes and the intervals. (4 points)
Answers: 1
Mathematics, 21.06.2019 21:50
What is the next step in the given proof? choose the most logical approach. a. statement: m 1 + m 2 + 2(m 3) = 180° reason: angle addition b. statement: m 1 + m 3 = m 2 + m 3 reason: transitive property of equality c. statement: m 1 = m 2 reason: subtraction property of equality d. statement: m 1 + m 2 = m 2 + m 3 reason: substitution property of equality e. statement: 2(m 1) = m 2 + m 3 reason: substitution property of equality
Answers: 3
Mathematics, 22.06.2019 01:20
Determine the vertex form of g(x) = x2 + 2x - 1. which graph represents g(x)? -nw -3-2-1, 1 1 2 3 -3 2- 1 -3- 1 2 3 - 1 2 3
Answers: 1
You know the right answer?
The speed of a falling object increases at a constant rate as time increases since the object was dr...
Questions
Mathematics, 25.08.2019 06:20

Biology, 25.08.2019 06:20


Social Studies, 25.08.2019 06:20
Mathematics, 25.08.2019 06:20
Biology, 25.08.2019 06:20

English, 25.08.2019 06:20

History, 25.08.2019 06:20


Chemistry, 25.08.2019 06:20


