
Mathematics, 24.10.2021 15:00 shealwaysknows23
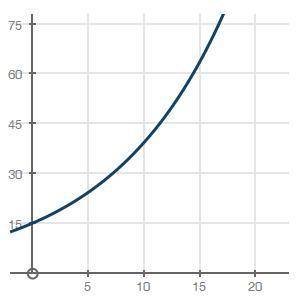
Jane is studying the rate at which the sale of a particular brand of chocolate has increased over the years. The graph below shows the number of bars sold, y, in thousands, after x years since the year 2000:
graph of y equals 15 multiplied by 1.1 to the power of x
What does the y-intercept of the graph represent?
A) Price of a bar of chocolate
B) Number of bars sold in 2000
C) Number of bars sold before 2000
D) Rate of increase in the sale of chocolates

Answers: 2


Another question on Mathematics
Mathematics, 21.06.2019 17:00
Which point lies on a circle with a radius of 5 units and center at p(6, 1)?
Answers: 1
Mathematics, 21.06.2019 19:00
The figures below are made out of circles, semicircles, quarter circles, and a square. find the area and the perimeter of each figure and give your answers as a completely simplified exact value in terms of π (no approximations).
Answers: 1
Mathematics, 21.06.2019 20:00
The scatterplot below shows the number of hours that students read weekly and the number of hours that they spend on chores weekly. which statement about the scatterplot is true?
Answers: 2
You know the right answer?
Jane is studying the rate at which the sale of a particular brand of chocolate has increased over th...
Questions
Mathematics, 28.06.2019 09:30

Physics, 28.06.2019 09:30

Chemistry, 28.06.2019 09:30

Mathematics, 28.06.2019 09:30

History, 28.06.2019 09:30


Mathematics, 28.06.2019 09:30
History, 28.06.2019 09:30


