
Mathematics, 17.10.2021 05:30 tavidallaz5988
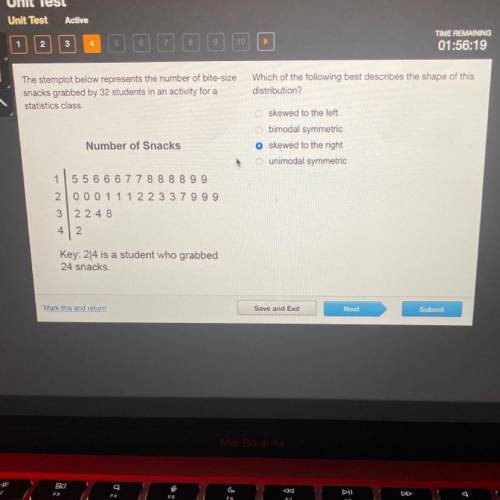
HELP!The stemplot below represents the number of bite-size
snacks grabbed by 32 students in an activity for a
statistics class.
Which of the following best describes the shape of this
distribution?
skewed to the left
Obimodal symmetric
skewed to the right
O unimodal symmetric
Number of Snacks
1 5 5 6 6 6 7 7 8 8 8 8 9 9
2000 1 1 1 2 2 3 3 7999
3 2248
4
2
Key: 24 is a student who grabbed
24 snacks.

Answers: 3


Another question on Mathematics
Mathematics, 21.06.2019 18:00
Carmen begins her next painting on a rectangular canvas that is 82.7 cm long and has a area of 8,137.68 cm2. will the painting fit in a frame with an opening that is 82.7 cm long and 95 cm wide? explain
Answers: 3
Mathematics, 22.06.2019 00:00
Cody ran nine miles on his first day of training. the next day he ran 1/8 that distance. how far did he run the second day?
Answers: 2
Mathematics, 22.06.2019 02:30
In terms of x, find an expression that represents the area of the shaded region. the outer square has side lengths of (x+5) and the inner square has side lengths of (x-2), as shown. area: a1 x + a2 square units submit
Answers: 3
You know the right answer?
HELP!The stemplot below represents the number of bite-size
snacks grabbed by 32 students in an act...
Questions


Mathematics, 18.09.2019 11:10
Mathematics, 18.09.2019 11:10

Chemistry, 18.09.2019 11:10

English, 18.09.2019 11:10


History, 18.09.2019 11:10

Biology, 18.09.2019 11:10
Mathematics, 18.09.2019 11:10

Business, 18.09.2019 11:10
English, 18.09.2019 11:10


