
Mathematics, 13.10.2021 01:50 mmaglaya1
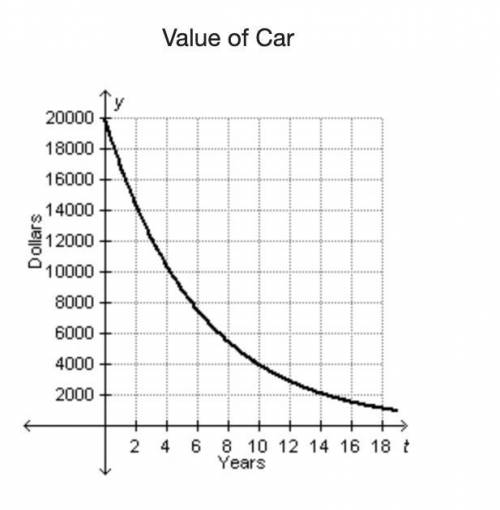
The graph below models the value of a $20,000 car t years after it was purchased.
Value of Car
A graph titled Value of Car has years on the x-axis and Dollars on the y-axis. A line curves down and goes through points (0, 20,000), (4, 10,000), and (14, 2,000).
Which statement best describes why the value of the car is a function of the number of years since it was purchased?
Each car value, y, is associated with exactly one time, t.
Each time, t, is associated with exactly one car value, y.
The rate at which the car decreases in value is not constant.
There is no time, t, at which the value of the car is 0.

Answers: 3


Another question on Mathematics
Mathematics, 21.06.2019 17:30
Lindsay used two points, (x,y; ) and (+2.82), to find the equation of the line, y = mx + b, that passes through the points. y2-y, first, she used the definition of slope and determined that the value of mis x, - . given this information, which expression must represent the value of b?
Answers: 2
Mathematics, 22.06.2019 00:40
Solve the following system of equations express your answer as an ordered pair in the format (a,b) with no spaces between the numbers of symbols 5x+2y=22
Answers: 2
You know the right answer?
The graph below models the value of a $20,000 car t years after it was purchased.
Value of Car
Questions

SAT, 27.12.2021 22:20
Mathematics, 27.12.2021 22:30

SAT, 27.12.2021 22:30


Social Studies, 27.12.2021 22:30
SAT, 27.12.2021 22:30

Chemistry, 27.12.2021 22:30

Geography, 27.12.2021 22:30
Mathematics, 27.12.2021 22:30
SAT, 27.12.2021 22:40
Mathematics, 27.12.2021 22:40
Business, 27.12.2021 22:40


