
Mathematics, 14.09.2021 06:20 gianna61
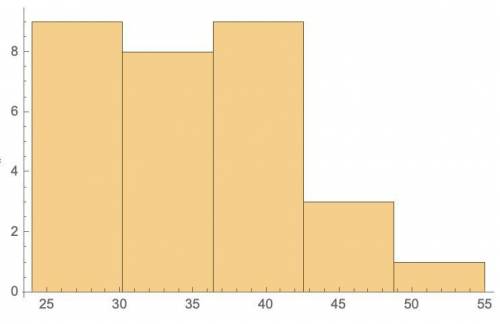
Create a frequency distribution, find the midpoint, relative frequency, cumulative frequency and create a histogram for the following:
Data Set: Highway fuel consumptions (in miles per gallon) for a sample of cars
Number of Classes: 5 classes
32, 35, 28, 40, 30, 42, 55, 40, 45, 24, 28, 34, 40, 36, 34, 40, 30, 25, 28, 32, 40, 35, 25, 44, 26, 39, 38, 42, 45, 32

Answers: 3


Another question on Mathematics
Mathematics, 21.06.2019 18:00
Based on the graph, what is the initial value of the linear relationship? a coordinate plane is shown. a line passes through the y-axis at -2 and the x-axis at 3.
Answers: 3
Mathematics, 21.06.2019 23:00
Susie wants to take her friend out for lunch.she wants to spend $9.75 each person. how much will she spend in all.
Answers: 2
Mathematics, 22.06.2019 00:00
The amount cami raised during last year’s charity walk, $45.50, is 7/10 of the amount she raised this year. which equation represents n, the number of dollars she raised this year?
Answers: 2
You know the right answer?
Create a frequency distribution, find the midpoint, relative frequency, cumulative frequency and cre...
Questions
Mathematics, 30.09.2019 02:30

History, 30.09.2019 02:30

Biology, 30.09.2019 02:30
Mathematics, 30.09.2019 02:30

English, 30.09.2019 02:30
Biology, 30.09.2019 02:30
Mathematics, 30.09.2019 02:30
Mathematics, 30.09.2019 02:30
Mathematics, 30.09.2019 02:30

Social Studies, 30.09.2019 02:30

Geography, 30.09.2019 02:30
English, 30.09.2019 02:30


