
Mathematics, 12.09.2021 14:00 melly6317
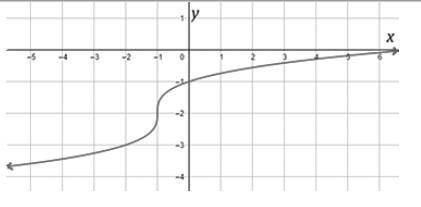
The figure above shows the graph of h(x) = x+1−−−−√3– 2, a translation of the parent function g(x) = x−−√3. How is the graph of the parent function translated?
Question 9 options:
A)
Left 1 unit and up 2 units
B)
Right 1 unit and up 2 units
C)
Left 1 unit and down 2 units
D)
Right 1 unit and down 2 units

Answers: 2


Another question on Mathematics
Mathematics, 21.06.2019 21:00
The area of a rectangle is 10 cm^2. one side of the rectangle is x cm. express the perimeter of the rectangle in terms of x and show that this rectangle cannot have a perimeter of 12 cm. the perimeter of the rectangle in terms of x is __ cm
Answers: 1
Mathematics, 21.06.2019 21:30
On traditional maps, earth is represented in a flat plane, or by euclidean geometry. however, a globe is a more accurate model that comes from elliptical geometry.how does a globe represent the fact that there are no parallel lines in elliptical geometry? the equator is not parallel to any other latitudinal lines. the north and south poles are never connected by a geodesic. the geodesics connecting the north and south poles never intersect. the geodesics connecting the north and south poles intersect at both of the poles.
Answers: 3
Mathematics, 21.06.2019 22:30
I’m really confused and need your assist me with this question i’ve never been taught
Answers: 1
Mathematics, 21.06.2019 23:00
Find the distance between c and d on the number line c=3 and d=11
Answers: 1
You know the right answer?
The figure above shows the graph of h(x) = x+1−−−−√3– 2, a translation of the parent function g(x) =...
Questions


Mathematics, 30.07.2020 04:01


Biology, 30.07.2020 04:01


