
Mathematics, 31.08.2021 01:00 mia3128
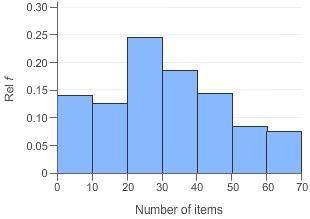
The histogram shows the number of items that customers bought during a trip to the grocery store one day. Four hundred customers took a trip to the grocery store that day.
PLEASE HELP!!! Which is the best estimate for the number who bought fewer than 30 items during their trip?
A histogram with Number of items on horizontal x-axis and relative frequency on vertical y-axis
204
106
278
148

Answers: 1


Another question on Mathematics
Mathematics, 21.06.2019 17:10
How many lines can be drawn through points j and k? 0 1 2 3
Answers: 2
Mathematics, 22.06.2019 00:00
Mrs. blake's bill at a restaurant is $42.75. she wants to leave the waiter an 18% tip. how much will she pay in all, including the tip?
Answers: 2
Mathematics, 22.06.2019 00:30
Julie begins counting backwards from 1000 by 2’s and at the same time tony begins counting forward from 100 by 3’s. if they count at the same rate, what number will they say at the same time?
Answers: 1
Mathematics, 22.06.2019 02:30
In july, the average temperature in one us city was 29°c. by december, the average temperature had fallen by 29°c. explain why the average temperature in december was 0°c.
Answers: 3
You know the right answer?
The histogram shows the number of items that customers bought during a trip to the grocery store one...
Questions


Biology, 05.05.2021 17:40
History, 05.05.2021 17:40
Mathematics, 05.05.2021 17:40
English, 05.05.2021 17:40
Mathematics, 05.05.2021 17:40
Mathematics, 05.05.2021 17:40

Social Studies, 05.05.2021 17:40
Social Studies, 05.05.2021 17:40


