
Mathematics, 24.08.2021 08:10 jenna34032
HELP ASAP
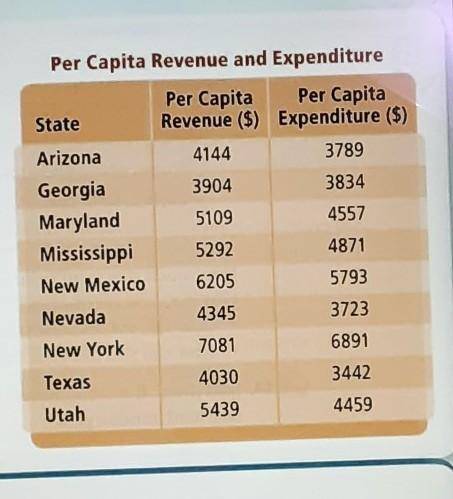
19. The table shows per capita revenues and expenditures for selected states for a recent year.
a. Show the data on a scatter plot. Draw a trend line.
b. If a state collected revenue of $3000 per capita, how much would you expect it to spend per capita?
c. Ohio spent $5142 per capita during that year. According to your model, how much did it collect in taxes per capita?
d. In that same year, New Jersey collected $5825 per capita in taxes and spent $5348 per capita. Does this information follow the trend? Explain.

Answers: 1


Another question on Mathematics
Mathematics, 21.06.2019 15:30
Guests at an amusement park must be at least 54 inches tall to be able to ride the roller coaster. which graph represents the set of heights that satisfy this requirement?
Answers: 3
Mathematics, 21.06.2019 18:00
Express in the simplest form: (x^2+9x+14/x^2-49) / (3x+6/x^2+x-56)
Answers: 3
Mathematics, 21.06.2019 20:00
Choose the linear inequality that describes the graph. the gray area represents the shaded region. a: y ≤ –4x – 2 b: y > –4x – 2 c: y ≥ –4x – 2 d: y < 4x – 2
Answers: 2
You know the right answer?
HELP ASAP
19. The table shows per capita revenues and expenditures for selected states for a recen...
Questions
Mathematics, 15.02.2021 23:50


Mathematics, 15.02.2021 23:50
Mathematics, 15.02.2021 23:50
Mathematics, 15.02.2021 23:50
Mathematics, 15.02.2021 23:50

Mathematics, 15.02.2021 23:50

Mathematics, 15.02.2021 23:50
Mathematics, 15.02.2021 23:50

Computers and Technology, 15.02.2021 23:50
English, 15.02.2021 23:50


