
Mathematics, 07.08.2021 17:20 levicorey846
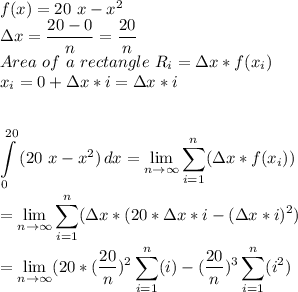
HELPP Sketch the graph of the function y = 20x − x2, and approximate the area under the curve in the interval [0, 20] by dividing the area into the given numbers of rectangles.
Part A
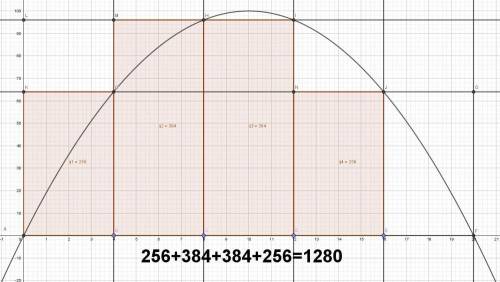
Use five rectangles to approximate the area under the curve.
Part B
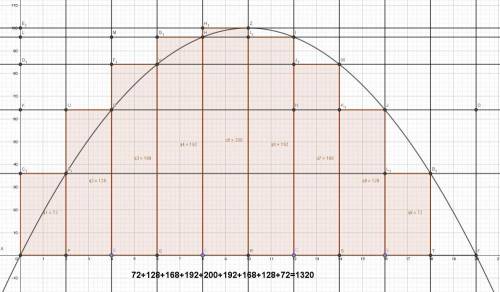
Use 10 rectangles to approximate the area under the curve.
Part C
Calculate the area under the curve using rectangles as their number becomes arbitrarily large (tends to infinity). You do not need to sketch the rectangles.

Answers: 3
![\displaystyle \sum_{i=1}^{n} i= \dfrac{n*(n+1)}{2} \\\\\displaystyle \sum_{i=1}^{n} i^2= \dfrac{n*(n+1)(2n+1)}{6} \\\\\\\int\limits^{20}_0 {(20\ x-x^2)} \, dx =[\dfrac{20\ x^2}{2} -\dfrac{x^3}{3} ]^{20}_0=\dfrac{20^3}{3} =1333.\overline{3}\\\\\\](/tpl/images/1405/7335/9341f.png)


Another question on Mathematics
Mathematics, 21.06.2019 17:00
You have $600,000 saved for retirement. your account earns 5.5% interest. how much, to the nearest dollar, will you be able to pull out each month, if you want to be able to take withdrawals for 20 years?
Answers: 1
Mathematics, 21.06.2019 21:30
What does independent variable and dependent variable mean in math?
Answers: 2
Mathematics, 22.06.2019 01:00
Rewrite the polynomial -9x5 + 36x4 + 189x3 in factored form.
Answers: 1
Mathematics, 22.06.2019 01:40
Jeremy wants to determine the number of solutions for the equation below without actually solving the equation.
Answers: 1
You know the right answer?
HELPP Sketch the graph of the function y = 20x − x2, and approximate the area under the curve in the...
Questions
Mathematics, 11.07.2019 01:30


Mathematics, 11.07.2019 01:30
Mathematics, 11.07.2019 01:30

Advanced Placement (AP), 11.07.2019 01:30
Mathematics, 11.07.2019 01:30
History, 11.07.2019 01:30
History, 11.07.2019 01:30
Mathematics, 11.07.2019 01:30

Physics, 11.07.2019 01:30
Mathematics, 11.07.2019 01:30
Mathematics, 11.07.2019 01:30
Biology, 11.07.2019 01:30
Mathematics, 11.07.2019 01:30
Mathematics, 11.07.2019 01:30


