
Mathematics, 06.08.2021 18:40 mzynique2000
Please help! Giving brainiest!
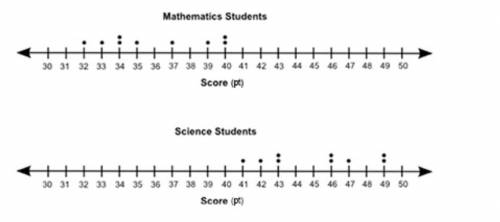
The dot plots below show the test scores of some mathematics students and some science students: (View the attached image) Based on visual inspection of the dot plots, which group of students appears to have the larger average score?
a. The mathematics students
b. the science students
c. Both groups are similar
d. Not enough information is available to draw a conclusion.

Answers: 3


Another question on Mathematics
Mathematics, 21.06.2019 13:10
Two different linear functions are shown below with two points given from each function. use slope-intercept form or point-slope form to find the equation of each. linear function a points: (–5, –2), (–5, 7) linear function b points: (7, –5), (–2, –5) function a has: the equation of line a is: function b has: the equation of line b is:
Answers: 1
Mathematics, 21.06.2019 17:30
Apositive number a or the same number a increased by 50% and then decreased by 50% of the result?
Answers: 3
Mathematics, 21.06.2019 21:20
An office supply company conducted a survey before marketing a new paper shredder designed for home use. in the survey, 80 % of the people who tried the shredder were satisfied with it. because of this high satisfaction rate, the company decided to market the new shredder. assume that 80 % of all people are satisfied with this shredder. during a certain month, 100 customers bought this shredder. find the probability that of these 100 customers, the number who are satisfied is 69 or fewer.
Answers: 2
Mathematics, 22.06.2019 00:00
(20 points) a bank has been receiving complaints from real estate agents that their customers have been waiting too long for mortgage confirmations. the bank prides itself on its mortgage application process and decides to investigate the claims. the bank manager takes a random sample of 20 customers whose mortgage applications have been processed in the last 6 months and finds the following wait times (in days): 5, 7, 22, 4, 12, 9, 9, 14, 3, 6, 5, 15, 10, 17, 12, 10, 9, 4, 10, 13 assume that the random variable x measures the number of days a customer waits for mortgage processing at this bank, and assume that x is normally distributed. 2a. find the sample mean of this data (x ě…). 2b. find the sample variance of x. find the variance of x ě…. for (c), (d), and (e), use the appropriate t-distribution 2c. find the 90% confidence interval for the population mean (îľ). 2d. test the hypothesis that îľ is equal to 7 at the 95% confidence level. (should you do a one-tailed or two-tailed test here? ) 2e. what is the approximate p-value of this hypothesis?
Answers: 2
You know the right answer?
Please help! Giving brainiest!
The dot plots below show the test scores of some mathematics student...
Questions
Mathematics, 20.07.2019 22:30
Mathematics, 20.07.2019 22:30

Mathematics, 20.07.2019 22:30

Computers and Technology, 20.07.2019 22:30
Mathematics, 20.07.2019 22:30
Mathematics, 20.07.2019 22:30

Mathematics, 20.07.2019 22:30

History, 20.07.2019 22:30
History, 20.07.2019 22:30
Mathematics, 20.07.2019 22:30

Spanish, 20.07.2019 22:30
History, 20.07.2019 22:30
Mathematics, 20.07.2019 22:30


