
Mathematics, 03.08.2021 23:30 JadeCaldwell
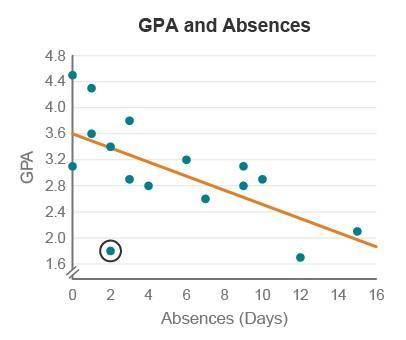
A guidance counselor wants to determine if there is a relationship between a student’s number of absences, x, and their grade point average (GPA), y. The data that were collected are displayed in the scatterplot and the least-squares regression line was calculated. One student with 2 absences has a GPA of 1.8. This point is circled on the graph.
(Graph is attached)
What effect does the circled point have on the slope and y-intercept of the least-squares regression line?
This point will increase the value of the slope and increase the value of the y-intercept.
This point will increase the value of the slope and decrease the value of the y-intercept.
This point will decrease the value of the slope and increase the value of the y-intercept.
This point will decrease the value of the slope and decrease the value of the y-intercept.
Yes, I know how to click and report. I will be reporting any troll answers.
The possible answers are C, D. I think it's D but I need someone to confirm.

Answers: 3


Another question on Mathematics
Mathematics, 21.06.2019 16:30
For how answer my question this will be the last question can you answer in math subject
Answers: 2
Mathematics, 21.06.2019 19:00
Solve 3x-18=2y and 5x-6y=14 by elimination or substitution . show all !
Answers: 1
Mathematics, 21.06.2019 19:30
Find the coordinates of point x that lies along the directed line segment from y(-8, 8) to t(-15, -13) and partitions the segment in the ratio of 5: 2.
Answers: 1
You know the right answer?
A guidance counselor wants to determine if there is a relationship between a student’s number of abs...
Questions

Chemistry, 13.04.2020 20:56

Biology, 13.04.2020 20:56

Geography, 13.04.2020 20:56


History, 13.04.2020 20:56

Mathematics, 13.04.2020 20:56
Mathematics, 13.04.2020 20:57

Social Studies, 13.04.2020 20:57
Mathematics, 13.04.2020 20:57
SAT, 13.04.2020 20:57
Mathematics, 13.04.2020 20:57


