Which models best illustrates the inequality and its graph?
t< 55
a.) t is at least...

Mathematics, 25.07.2021 07:30 sickomode2048
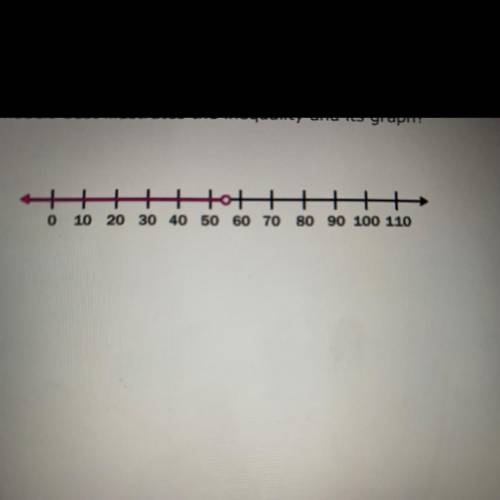
Which models best illustrates the inequality and its graph?
t< 55
a.) t is at least 55
b.) t is less than 55
c.) t is 55 or more
d.) t is at most 55

Answers: 1


Another question on Mathematics
Mathematics, 21.06.2019 18:30
Find the area of the regular hexagon if a side is 20 cm.
Answers: 2
Mathematics, 21.06.2019 18:50
Question b of 10which of the following describe an angle with a vertex at a? check all that applyo a. labcов. савd dooo c_baco d. zacb
Answers: 1
Mathematics, 21.06.2019 22:00
Given: △acm, m∠c=90°, cp ⊥ am , ac: cm=3: 4, mp-ap=1. find am.
Answers: 2
Mathematics, 22.06.2019 00:20
Biggest exam of the which of the following are polynomial functions?
Answers: 1
You know the right answer?
Questions

Mathematics, 21.03.2020 10:58

Mathematics, 21.03.2020 10:58


Mathematics, 21.03.2020 10:59

Biology, 21.03.2020 10:59

Computers and Technology, 21.03.2020 10:59


