Part A
Using the stock information found during your research, complete the table.
Part...

Mathematics, 24.07.2021 20:10 lindasuebairdoyjpf7
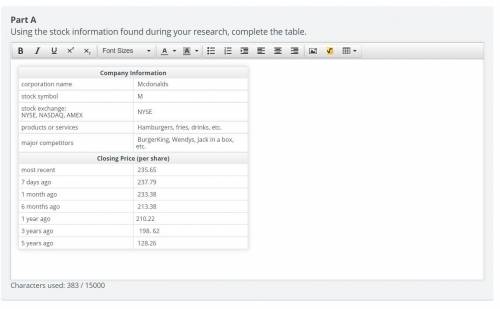
Part A
Using the stock information found during your research, complete the table.
Part B
Use the information you’ve gathered about the stock to answer these questions.
Question 1
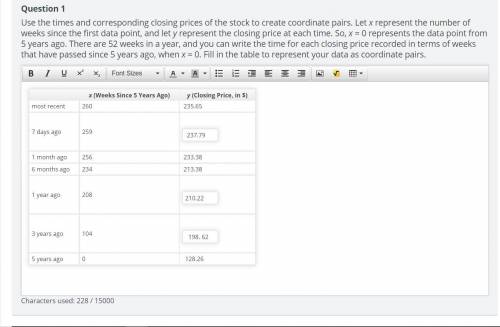
Use the times and corresponding closing prices of the stock to create coordinate pairs. Let x represent the number of weeks since the first data point, and let y represent the closing price at each time. So, x = 0 represents the data point from 5 years ago. There are 52 weeks in a year, and you can write the time for each closing price recorded in terms of weeks that have passed since 5 years ago, when x = 0. Fill in the table to represent your data as coordinate pairs.
Question 2
Open the graphing tool, and select the data tab. Copy and paste your data from the table (x- and y-coordinates). Don’t include any dollar signs. Plot the data on the graph.
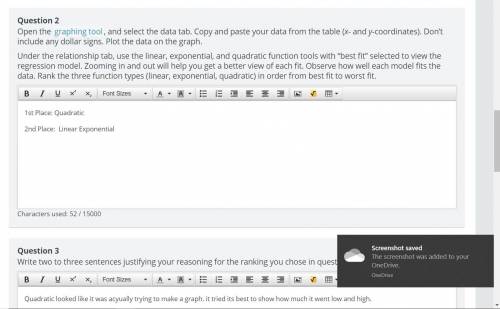
Under the relationship tab, use the linear, exponential, and quadratic function tools with “best fit” selected to view the regression model. Zooming in and out will help you get a better view of each fit. Observe how well each model fits the data. Rank the three function types (linear, exponential, quadratic) in order from best fit to worst fit.
Question 3
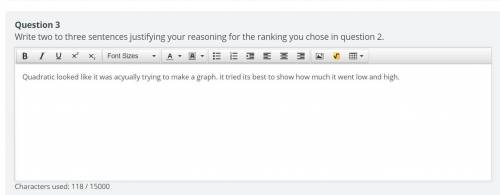
Write two to three sentences justifying your reasoning for the ranking you chose in question 2.
Part C
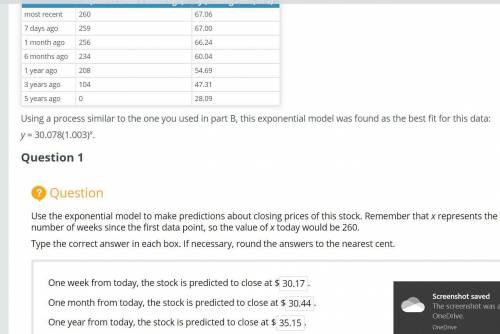
Stock values for a certain company are recorded in the table.
Using a process similar to the one you used in part B, this exponential model was found as the best fit for this data:
y = 30.078(1.003)x.
Use the exponential model to make predictions about closing prices of this stock. Remember that x represents the number of weeks since the first data point, so the value of x today would be 260.
Type the correct answer in each box. If necessary, round the answers to the nearest cent.
Do you think the model is a good predictor of the future closing price of the stock? Justify your response in three to four sentences.

Answers: 1


Another question on Mathematics
Mathematics, 21.06.2019 14:50
Eight people were asked what the balance of their savings account at the beginning of the month was and how much it increased or decreased by the end of the month. create a scatter plot that represents the data that is shown in the table. the x-axis represents the beginning balance in thousands of dollars and the y-axis represents the change in the savings account in hundreds of dollars. name beginning balance (in thousands of dollars) change in savings account (in hundreds of dollars) jimmy 5 3 kendra 4 7 carlos 5 4 yolanda 3 1 shawn 2 5 laura 3 2 andy 5 6 georgia 4 3
Answers: 1
Mathematics, 21.06.2019 16:00
Which rational number could be graphed between -4 and -5
Answers: 1
Mathematics, 21.06.2019 16:30
896.31 cm= km 100cm = 1m 1000m = 1km a) 0.0089631 b) 0.0089631 c) 8.9631 d) 89.631
Answers: 2
You know the right answer?
Questions

Advanced Placement (AP), 10.02.2022 03:10
Mathematics, 10.02.2022 03:10
Mathematics, 10.02.2022 03:10

Spanish, 10.02.2022 03:10
Mathematics, 10.02.2022 03:10
Mathematics, 10.02.2022 03:10

English, 10.02.2022 03:10

Chemistry, 10.02.2022 03:20

History, 10.02.2022 03:20


English, 10.02.2022 03:20

Social Studies, 10.02.2022 03:20
Mathematics, 10.02.2022 03:20
English, 10.02.2022 03:20
English, 10.02.2022 03:20


