
Mathematics, 22.07.2021 22:20 unruhlsY25
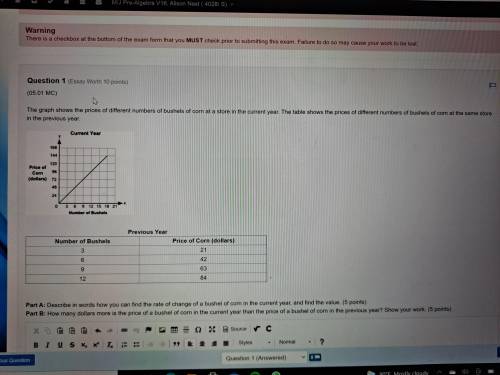
The graph shows the prices of different numbers of bushels of corn at a store in the current year. The table shows the prices of different numbers of bushels of corn at the same store in the previous year.
A graph shows Number of Bushels on x-axis and Price of Corn in dollars on y-axis. The x-axis scale is shown from 0 to 21 at increments of 3, and the y-axis scale is shown from 0 to 168 at increments of 24. A straight line joins the ordered pairs 3, 24 and 6, 48 and 9, 72 and 12, 96 and 15, 120 and 18, 144.
Previous Year
Number of Bushels
Price of Corn (dollars)
3
21
6
42
9
63
12
84
Part A: Describe in words how you can find the rate of change of a bushel of corn in the current year, and find the value. (5 points)
Part B: How many dollars more is the price of a bushel of corn in the current year than the price of a bushel of corn in the previous year? Show your work. (5 points)

Answers: 2


Another question on Mathematics
Mathematics, 21.06.2019 13:40
How do you use the additive inverse to evaluate an expression that uses subtraction in a full sentence
Answers: 3
Mathematics, 21.06.2019 19:50
Polygon abcde is reflected to produce polygon a′b′c′d′e′. what is the equation for the line of reflection?
Answers: 1
Mathematics, 21.06.2019 20:00
What sums are equal to 6/12? choose all answers that are correct a.6/12+6/12+6/12+6/12+6/12+6/12 b.2/12+1/12+1/12+2/12 c.5/12+1/12 d.1/12+1/12+1/12+3/12 plz : )
Answers: 1
Mathematics, 21.06.2019 21:30
About 9% of th population is hopelessly romantic. if 2 people are randomly selected from the population, what is the probability that at least 1 person is hopelessly romantic?
Answers: 1
You know the right answer?
The graph shows the prices of different numbers of bushels of corn at a store in the current year. T...
Questions


Mathematics, 21.04.2020 06:56
Mathematics, 21.04.2020 06:56
Mathematics, 21.04.2020 06:56
English, 21.04.2020 06:56


Arts, 21.04.2020 06:57


