
Mathematics, 22.07.2021 08:20 holman9308
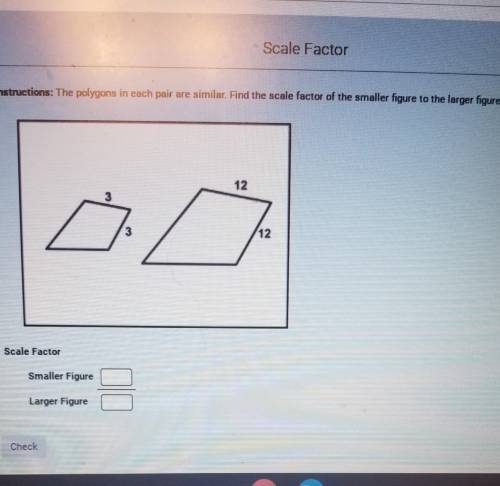
the polygons in each pair are similar. find the scale factor of the smaller figure to the larger figure.

Answers: 2


Another question on Mathematics
Mathematics, 21.06.2019 17:20
Four airplanes carrying a total of 400 passengersarrive at the detroit airport. the airplanes carry, respectively,50, 80, 110, and 160 passengers.a) one of the 400 passengers is selected uniformly at random.let x denote the number of passengers that were on theairplane carrying the randomly selected passenger. find var(x)for x as given in the problemb) one of the 4 airplane drivers is also selected uniformly atrandom. let y denote the number of passengers on the chosen driver’s airplane. find var(y) for y as given in the problem
Answers: 3
Mathematics, 21.06.2019 19:30
At the beginning of 1974/75,2 years a man invested #2000 in a bank at 12.5% compound interest, if it degree #650 at the end of each two years to pay his son's school fees, after payment of interest to pay his son's school fees, how much did he have left at the beginning of the 1978/79 school year?
Answers: 3
Mathematics, 22.06.2019 00:20
Last week , donnell practiced the piano 3 hours longer than marcus . together, marcus and donnell practiced the piano 11 hours . for how many hours did each young man practiced the piano
Answers: 3
Mathematics, 22.06.2019 02:30
Atrain traveled for 1.5 hours to the first station, stopped for 30 minutes, then traveled for 4 hours to the final station where it stopped for 1 hour. the total distance traveled is a function of time. which graph most accurately represents this scenario? a graph is shown with the x-axis labeled time (in hours) and the y-axis labeled total distance (in miles). the line begins at the origin and moves upward for 1.5 hours. the line then continues upward at a slow rate until 2 hours. from 2 to 6 hours, the line continues quickly upward. from 6 to 7 hours, it moves downward until it touches the x-axis a graph is shown with the axis labeled time (in hours) and the y axis labeled total distance (in miles). a line is shown beginning at the origin. the line moves upward until 1.5 hours, then is a horizontal line until 2 hours. the line moves quickly upward again until 6 hours, and then is horizontal until 7 hours a graph is shown with the axis labeled time (in hours) and the y-axis labeled total distance (in miles). the line begins at the y-axis where y equals 125. it is horizontal until 1.5 hours, then moves downward until 2 hours where it touches the x-axis. the line moves upward until 6 hours and then moves downward until 7 hours where it touches the x-axis a graph is shown with the axis labeled time (in hours) and the y-axis labeled total distance (in miles). the line begins at y equals 125 and is horizontal for 1.5 hours. the line moves downward until 2 hours, then back up until 5.5 hours. the line is horizontal from 5.5 to 7 hours
Answers: 1
You know the right answer?
the polygons in each pair are similar. find the scale factor of the smaller figure to the larger fig...
Questions


Mathematics, 05.03.2021 20:40

Law, 05.03.2021 20:40
Mathematics, 05.03.2021 20:40
Mathematics, 05.03.2021 20:40
Mathematics, 05.03.2021 20:40
Mathematics, 05.03.2021 20:40
Mathematics, 05.03.2021 20:40
Mathematics, 05.03.2021 20:40
Mathematics, 05.03.2021 20:40
Mathematics, 05.03.2021 20:40

Health, 05.03.2021 20:40

Mathematics, 05.03.2021 20:40


