
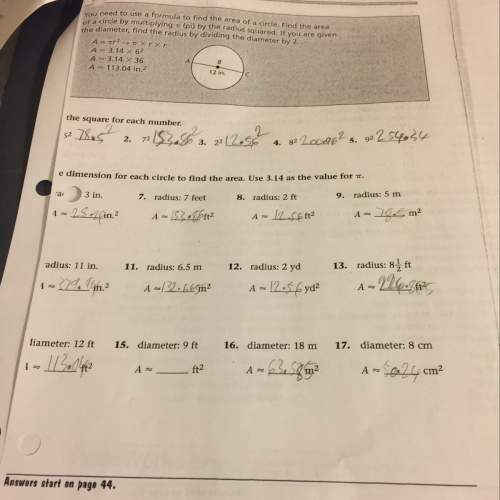
Mathematics, 16.07.2021 23:40 glowbaby123
I NEED TI=O KNOW ASAP!!
The graph shows a journey in a car. Which of the statements most likely describes the start of the journey at the portion of the graph labeled I?
A line graph is drawn on the first quadrant of a coordinate plane. The x-axis is labeled Time in seconds, and the y-axis is labeled Distance in miles. The line graph is divided into 7 segments labeled I, J, K, L, M, N, and O. I starts at the origin and is a straight line slanting up. J is a line segment that starts at the end of I and is horizontal. K is a curve that starts at the end of J and curves up. L is a straight line that starts at the end of K and is horizontal. M is a straight line that starts at the end of L and slopes down. N is a straight line that starts at the end of M and is horizontal. O is a curve that starts at the end of N and curves down to finally touch the x-axis.
answer choices
The car travels the same distance per unit of time because the portion shows a linear, increasing function.
The car travels different distances per unit of time because the portion shows a linear, increasing function.
The car travels the same distance per unit of time because the portion shows a nonlinear, increasing function.
The car travels different distances per unit of time because the portion shows a nonlinear, increasing function.

Answers: 3


Another question on Mathematics
Mathematics, 21.06.2019 20:40
The graph of a function f(x)=(x+2)(x-4). which describes all of the values for which the graph is negative and increasing? all real values of x where x< -2 all real values of x where -2
Answers: 2
Mathematics, 21.06.2019 22:30
Amachine that produces a special type of transistor (a component of computers) has a 2% defective rate. the production is considered a random process where each transistor is independent of the others. (a) what is the probability that the 10th transistor produced is the first with a defect? (b) what is the probability that the machine produces no defective transistors in a batch of 100? (c) on average, how many transistors would you expect to be produced before the first with a defect? what is the standard deviation? (d) another machine that also produces transistors has a 5% defective rate where each transistor is produced independent of the others. on average how many transistors would you expect to be produced with this machine before the first with a defect? what is the standard deviation? (e) based on your answers to parts (c) and (d), how does increasing the probability of an event a↵ect the mean and standard deviation of the wait time until success?
Answers: 3
Mathematics, 22.06.2019 00:20
Which shows how to solve the equation 3/4x=6 for x in one step?
Answers: 2
Mathematics, 22.06.2019 01:00
The correlation coefficient between the number of students and marks obtained in end semester exam. (13 marks) give the statistical meaning of the relationship between the number of students and marks b. obtained in end semester exam. (3 marks) draw the number of students and marks obtained in end semester exam scatter diagram c. (4 marks) check list write your name and id corectly write the question number properly use your own calculator. show all the steps to solve the problems. use the correct formula. answer in provided time. don't use your mobile for any purpose. write your answer up to two decimal places
Answers: 3
You know the right answer?
I NEED TI=O KNOW ASAP!!
The graph shows a journey in a car. Which of the statements most likely des...
Questions
Mathematics, 24.09.2019 04:00

Social Studies, 24.09.2019 04:00

Health, 24.09.2019 04:00

Advanced Placement (AP), 24.09.2019 04:00

Business, 24.09.2019 04:00

Physics, 24.09.2019 04:00

Biology, 24.09.2019 04:00
Mathematics, 24.09.2019 04:00

Engineering, 24.09.2019 04:00
Mathematics, 24.09.2019 04:00
Mathematics, 24.09.2019 04:00


