See attachment
Step-by-step explanation:
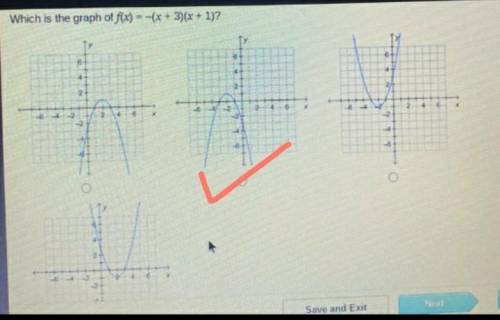
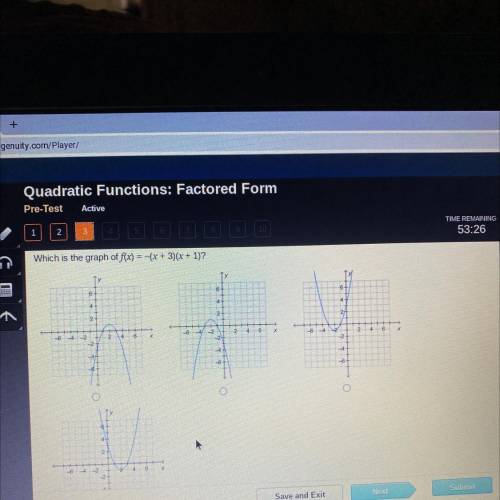
A function is given to us and we need to tell which graph represents the given function. The function given to us is,

Let's find out at which points do the graph Intersects x axis / finding the roots. For that substitute f(x) = 0 , we have ,

Equate each factor by 0 ,
Therefore the graph will intersect x axis at x is equal to -1 and x is equal to -3 .
On looking at the given graphs in the options the second graph intersects x axis at -1 and -3 .
Hence the second option is correct .
{ See attachment }