Answer: choice c and choice d
=====================================
explanation
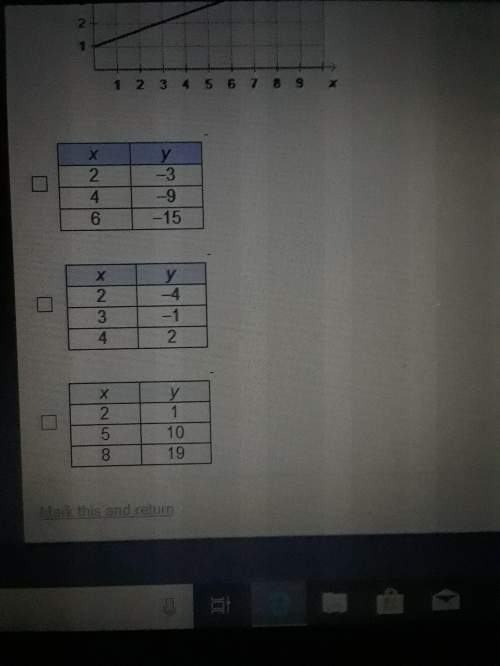
the graph has a slope of 1/3 because each time you move up 1, you go to the right 3. so, slope = rise/run = 1/3. we can cross choice a off the list since we want a slope of 3, rather than 1/3.
the first table shown has a slope of -3. this is because the rise is -6 and the run is 2, so slope = rise/run = -6/2 = -3. note how x increases by 2 each time (run) and y drops by 6 each time (rise). choice b can be eliminated.
the second table has a slope of 3. each time x goes up by 1, the y values increase by 3. slope = rise/run = 3/1 = 3. alternatively you can use the slope formula to prove that the slope is 3 here. use any two rows of values to generate the two points. choice c is one of the answers
the third table also has a slope of 3. let's use the slope formula to prove as such. i'm going to use the first two rows of the table. so i'll use the two points (2,1) and (5,10)
m = slope
m = (y2-y1)/(x2-x1)
m = (10-1)/(5-2)
m = 9/3
m = 3 so we get a slope of 3
choice d is the other answer