Question 5 of 10
Select the correct answer.
The graph shows a line of best fit for data colle...

Mathematics, 08.07.2021 07:30 savannahvargas512
Question 5 of 10
Select the correct answer.
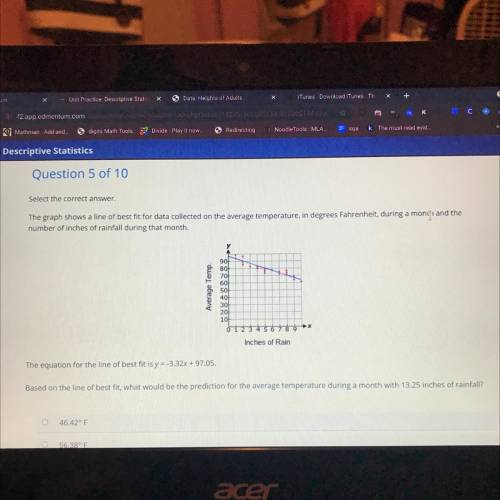
The graph shows a line of best fit for data collected on the average temperature, in degrees Fahrenheit, during a month and the
number of inches of rainfall during that month.
Average Temp.
90
80
70
60
50
404
30
20
10
1 1 2 3 4 5 6
X
Inches of Rain
The equation for the line of best fit is y = -3.32x + 97.05.
Based on the line of best fit, what would be the prediction for the average temperature during a month with 13.25 inches of rainfall?

Answers: 3


Another question on Mathematics
Mathematics, 21.06.2019 23:00
Which equation is equivalent to the given expression? -(1/2y+1/4) a. -1/4(1+2y) b. 1/4(2y-1) c. -2(1/4y-1/8) d. 2(1/8-1/4y)
Answers: 1
You know the right answer?
Questions


Mathematics, 04.02.2020 12:51

Mathematics, 04.02.2020 12:51
Mathematics, 04.02.2020 12:51


Mathematics, 04.02.2020 12:51


