Drag the tiles to the correct boxes to complete the pairs.
The graph represents the average c...

Mathematics, 24.06.2021 06:40 sindy35111
Drag the tiles to the correct boxes to complete the pairs.
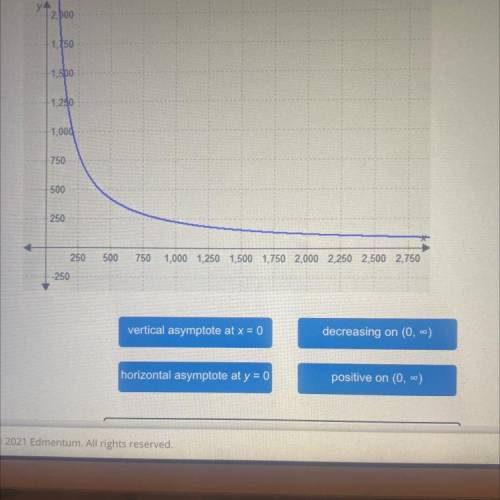
The graph represents the average cost to produce pills, in dollars, as function of the number of pills manufactured by a pharmaceutical company. Match each key feature of function with its interpretation in the scenario.
Box 1: As more pills are produced, the average cost per pill decrease.
Box 2: The cost producing pills can never reach 0.
Box 3: The cost of producing pills cannot be negative.
Box 4: As the number of pills produced gets smaller, the average cost of production greatly increase.

Answers: 1


Another question on Mathematics
Mathematics, 21.06.2019 13:30
Which of the following lines is not parallel to the graph of y = 4x +7?
Answers: 1
Mathematics, 21.06.2019 20:50
The cost of turkey is directly proportional to its weight. if a 12-pount turkey costs $27, how much does a 16-pound turkey cost? a. $33.75 b. $36.00 c. $31.00 d. $32.50
Answers: 3
Mathematics, 21.06.2019 23:30
What is the volume of a rectangular crate that has dimensions 9 inches by 9 inches by 1 feet? 1,458 in.3 121.5 in.3 1,012.5 in.3 36 in.3
Answers: 1
Mathematics, 21.06.2019 23:30
Write an inequality for this sentence the quotient of a number and -5 increased by 4 is at most 8
Answers: 1
You know the right answer?
Questions

Computers and Technology, 26.11.2021 23:10

Business, 26.11.2021 23:10

Geography, 26.11.2021 23:10
Mathematics, 26.11.2021 23:10

English, 26.11.2021 23:10
Mathematics, 26.11.2021 23:10
Mathematics, 26.11.2021 23:10

Physics, 26.11.2021 23:10
SAT, 26.11.2021 23:10

Chemistry, 26.11.2021 23:10

Biology, 26.11.2021 23:10
Biology, 26.11.2021 23:10
Business, 26.11.2021 23:10


