This table shows values that represent a quadratic function.
х
y
0
-1
1
SON
| N|مي | |
-10
4
-17
-26
6
-37
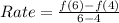
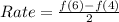
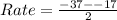
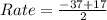
What is the average rate of change for this quadratic function for the interval
from x= 4 to x= 6?
A. 10
B. -10
C. 20
D. -20
The box plots show the average speeds, in miles per hour, for the race cars in two different races. which correctly describes the consistency of the speeds of the cars in the two races?