
Mathematics, 16.06.2021 21:10 yorbal171
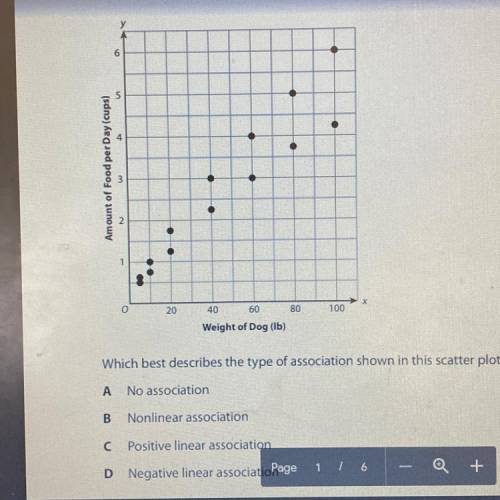
The scatter plot below represents the amount of dog food a brand recommends
based on the weight of the dog.
Amount of Food per Day cups
20
40
60
No
100
Weight of Dog (b)
Which best describes the type of association shown in this scatter plot?
A
No association
B Nonlinear association
C Positive linear association
D Negative linear association

Answers: 2


Another question on Mathematics
Mathematics, 21.06.2019 18:00
Jack has a piece of red ribbon that is two times as long as his piece of blue ribbon. he says that he can use two different equation to find out how long his piece of red ribbon is compared to his piece of blue ribbon is. is he correct? explain his reasoning
Answers: 1
Mathematics, 21.06.2019 22:00
Set up and solve a proportion for the following application problem. if 55 pounds of grass seed cover 404 square feet, how many pounds are needed for 7272 square feet?
Answers: 1
Mathematics, 21.06.2019 23:40
From the top of a tree a bird looks down on a field mouse at an angle of depression of 50°. if the field mouse is 40 meters from the base of the tree, find the vertical distance from the ground to the bird's eyes.
Answers: 1
Mathematics, 22.06.2019 00:00
Evan went to the park and saw for animals each animal was either a duck or dog if he saw a total of 14 legs how many of each animal did he see
Answers: 1
You know the right answer?
The scatter plot below represents the amount of dog food a brand recommends
based on the weight of...
Questions

Biology, 31.03.2020 21:18

Mathematics, 31.03.2020 21:18
Biology, 31.03.2020 21:18


Chemistry, 31.03.2020 21:18


English, 31.03.2020 21:18


