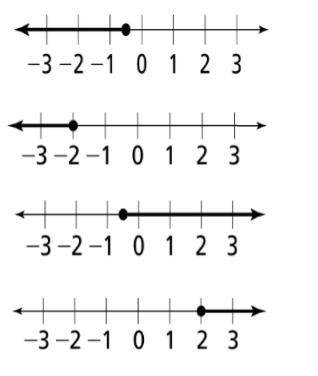
Which graph represents the solution of the inequality below?
–1.2x – 6.5x ≤ 2.3x + 5
I R...

Mathematics, 14.06.2021 16:10 genyjoannerubiera
Which graph represents the solution of the inequality below?
–1.2x – 6.5x ≤ 2.3x + 5
I REALLY NEED HELP

Answers: 1


Another question on Mathematics
Mathematics, 21.06.2019 18:30
According to the 2008 u.s. census, california had a population of approximately 4 × 10^7 people and florida had a population of approximately 2 × 10^7 people. which of the following is true? a. the population of florida was approximately two times the population of california. b. the population of florida was approximately twenty times the population of california. c. the population of california was approximately twenty times the population of florida. d. the population of california was approximately two times the population of florida.
Answers: 1
Mathematics, 21.06.2019 21:00
Me! i will mark you brainliest if you are right and show your i don't get polynomials and all the other stuff. multiply and simplify.2x(^2)y(^3)z(^2) · 4xy(^4)x(^2)show your
Answers: 2
Mathematics, 21.06.2019 22:00
Liz is shipping a package to her friend. the maximum weight of a medium flat-rate box is 20 pounds, including the box which weighs 6 ounces. write and solve an inequality to describe the possible weight in pounds, w, of the contents that liz will ship to her friend if she must use a medium flat-rate box. use the drop-down menus to explain your answer.
Answers: 2
Mathematics, 21.06.2019 23:00
What is the value of x in the equation7x+2y=48 when y=3
Answers: 2
You know the right answer?
Questions

Chemistry, 10.03.2021 01:00
Mathematics, 10.03.2021 01:00

Mathematics, 10.03.2021 01:00

Computers and Technology, 10.03.2021 01:00


History, 10.03.2021 01:00
Mathematics, 10.03.2021 01:00
Mathematics, 10.03.2021 01:00
English, 10.03.2021 01:00


