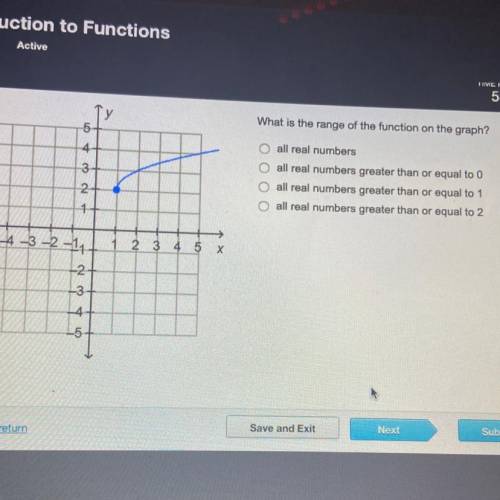
D. all real numbers greater than or equal to 2
Step-by-step explanation:
Range values consists of all possible set of y-value plotted on the vertical axis. So, we are looking at the y-values on the y-axis (vertical axis).
The line starts at 2 on the y-axis. The shaded "o" means that 2 is included or the range of the function is 2 or above.
Thus, this means that:
the range of the function of the graph are "all real numbers greater than or equal to 2."