
Mathematics, 10.06.2021 22:50 gracetay6873
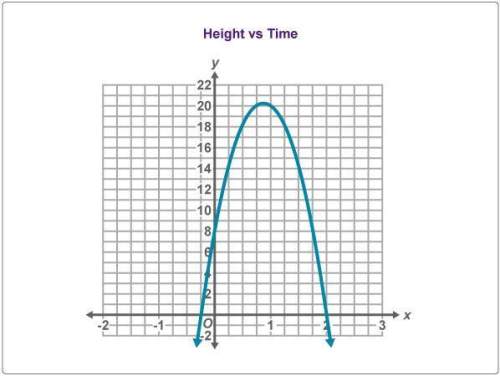
Assume you have collected data pairs (x, y) on a certain variety of tree. X is the number of weeks since the tree was planted and y is the height of the treein inches. A plot of the data points with the best-fit line is given below. What Age is predicted by the best-fit line for a height of 90 inches?

Answers: 1


Another question on Mathematics
Mathematics, 21.06.2019 15:30
What is this inequality notation? t is less then or equal to 2
Answers: 3
Mathematics, 21.06.2019 17:30
Arefrigeration system at your company uses temperature sensors fixed to read celsius (°c) values, but the system operators in your control room understand only the fahrenheit scale. you have been asked to make a fahrenheit (°f) label for the high temperature alarm, which is set to ring whenever the system temperature rises above –10°c. what fahrenheit value should you write on the label
Answers: 1
Mathematics, 21.06.2019 18:00
Plz determine whether the polynomial is a difference of squares and if it is, factor it. y2 – 196 is a difference of squares: (y + 14)2 is a difference of squares: (y – 14)2 is a difference of squares: (y + 14)(y – 14) is not a difference of squares
Answers: 1
You know the right answer?
Assume you have collected data pairs (x, y) on a certain variety of tree. X is the number of weeks s...
Questions

History, 27.04.2020 02:12

Computers and Technology, 27.04.2020 02:12


Social Studies, 27.04.2020 02:12
History, 27.04.2020 02:12

Biology, 27.04.2020 02:12
Mathematics, 27.04.2020 02:12

History, 27.04.2020 02:12
Mathematics, 27.04.2020 02:12

Mathematics, 27.04.2020 02:12
Social Studies, 27.04.2020 02:12
Mathematics, 27.04.2020 02:12
Mathematics, 27.04.2020 02:12


