
Mathematics, 10.06.2021 19:50 joooselinn9688
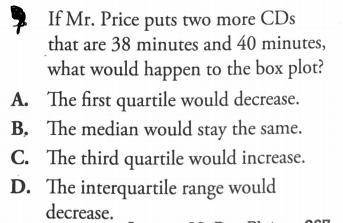
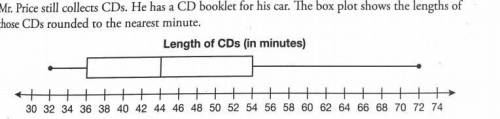
Please answer the question in the image
IQR = The interquartile range ( IQR ) is the range of values that resides in the middle of the scores. When a distribution is skewed, and the median is used instead of the mean to show a central tendency, the appropriate measure of variability is the Interquartile range. Q 1 – Lower Quartile Part Q 2 – Median
my teachers hint (not sure)
Hint: you might want to make up data set with even number of values that will fit the box plot provided;
then add values of 38 and 40 to your data set and make it data set 2; find quartiles for each data set: lastly compare quartiles and IQRs

Answers: 1


Another question on Mathematics
Mathematics, 21.06.2019 20:00
Find the value of x. round the length to the nearest tenth
Answers: 1
You know the right answer?
Please answer the question in the image
IQR = The interquartile range ( IQR ) is the range of value...
Questions


Business, 05.01.2021 23:20

Mathematics, 05.01.2021 23:20

Mathematics, 05.01.2021 23:20


Chemistry, 05.01.2021 23:20
Mathematics, 05.01.2021 23:20

Mathematics, 05.01.2021 23:20


