
Mathematics, 03.06.2021 20:20 tttyson
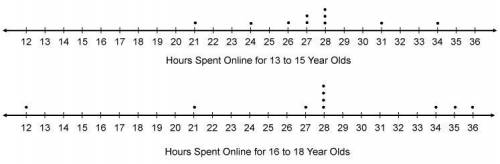
The line plots show the number of hours two groups of teens spent online last week.
How does the data compare for the two groups of teens?
The 16- to 18-year olds spent about the same hours online, on average, as the 13- to 15-year olds.
The range of hours spent online for the 13- to 15-year olds is greater than the range of hours spent online for the 16- to 18-year olds.
The mode for the hours spent online for the 13- to 15-year olds is greater than the mode for the hours last week for the 16- to 18-year olds.
The median value for the hours spent online for the 13- to 15-year olds is greater than the median value for the hours spent online for the 16- to 18- year olds.

Answers: 3


Another question on Mathematics
Mathematics, 21.06.2019 19:30
Lin is writing an equation to model the proportional relationship between y, the total cost in dollars of downloading videos from a website, and x, the number of videos downloaded. she knows that the total cost to download 3 videos was $12. her work to find the equation is shown below. joylin’s work step 1 k= 3/12= 0.25 step 2 y= 0.25x where did joylin make her first error?
Answers: 2
Mathematics, 22.06.2019 01:20
Anita has a success rate of 80% on free throws in basketball. she wants to know the estimated probability that she can make exactly four of five free throws in her next game. how can she simulate this scenario? categorize each simulation of this scenario as correct or incorrect.
Answers: 2
Mathematics, 22.06.2019 01:30
Given are five observations for two variables, x and y. xi 1 2 3 4 5 yi 3 7 5 11 14 which of the following is a scatter diagrams accurately represents the data? what does the scatter diagram developed in part (a) indicate about the relationship between the two variables? try to approximate the relationship betwen x and y by drawing a straight line through the data. which of the following is a scatter diagrams accurately represents the data? develop the estimated regression equation by computing the values of b 0 and b 1 using equations (14.6) and (14.7) (to 1 decimal). = + x use the estimated regression equation to predict the value of y when x = 4 (to 1 decimal). =
Answers: 3
Mathematics, 22.06.2019 03:30
The mountain springs water company has two departments, purifying and bottling. the bottling department received 67,000 liters from the purifying department. during the period, the bottling department completed 65,000 liters, including 3,000 liters of work in process at the beginning of the period. the ending work in process was 5,000 liters. how many liters were started and completed during the period?
Answers: 3
You know the right answer?
The line plots show the number of hours two groups of teens spent online last week.
How does the da...
Questions
Mathematics, 30.09.2019 01:50
Mathematics, 30.09.2019 01:50


History, 30.09.2019 01:50

Business, 30.09.2019 01:50

Biology, 30.09.2019 01:50
Biology, 30.09.2019 01:50

English, 30.09.2019 01:50

Geography, 30.09.2019 01:50
Mathematics, 30.09.2019 01:50

Business, 30.09.2019 01:50
History, 30.09.2019 01:50
History, 30.09.2019 01:50
History, 30.09.2019 01:50


