9514 1404 393
B
Step-by-step explanation:
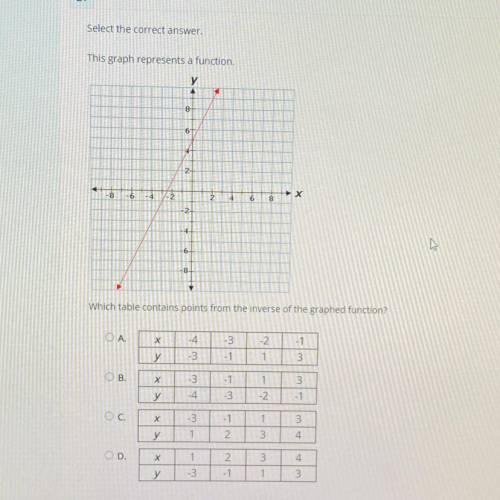
To find the graph of the inverse function, swap the labels x and y on the axes of the given graph.
There are no x-values common to all the tables, but you can make a determination of the correct one by looking at x=1 and x=-1.
After you swap the axis labels you see that the points ...
(x, y) = (1, -2) or (-1, -3)
are on the graph. These points are only found in the table of selection B.