
Mathematics, 24.05.2021 05:40 christopherschool04
The results of an analysis, on the makeup of garbage, done by the Environmental Protection Agency was published in 1990. Some of the results are given in the following table, which for various years gives the number of pounds per person per day of various types of waste materials.
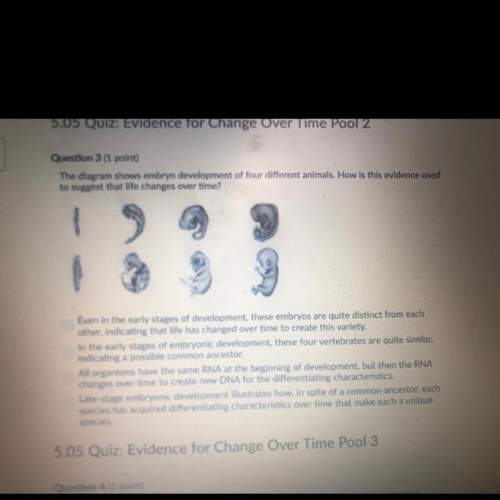
Waste Materials
1960
1970
1980
1988
Glass
0.20
0.34
0.36
0.28
Plastics
0.01
0.08
0.19
0.32
Metals
0.32
0.38
0.35
0.34
Paper
0.91
1.19
1.32
1.60
For plastics, calculate the average rates of change between consecutive data points in the table. Interpret the meaning of your results.
a.
The rate of increase increases from each decade to the next.
c.
The rate of increase increases during the 1970's, but then decreases during the 1980's.
b.
The rate of increase decreases from each decade to the next.
d.
The rate of increase decreases during the 1970's, but then increases during the 1980's.
Please select the best answer from the choices provided
A
B
C
D

Answers: 2


Another question on Mathematics
Mathematics, 21.06.2019 18:00
Need on this geometry question. explain how you did it.
Answers: 2
Mathematics, 21.06.2019 19:20
Which number completes the system of linear inequalities represented by the graph? y> 2x – 2 and x + 4y 2 et 2 3 4
Answers: 3
Mathematics, 21.06.2019 19:30
Hey am have account in but wished to create an account here you guys will me with my make new friends of uk !
Answers: 1
Mathematics, 21.06.2019 23:30
The triangle shown has a hypotenuse with a length of 13 feet. the measure of angle a is 20 degrees. and the measure of angle b is 70 degrees. which of the following is closest to the length, in feet, of line segment ac? no need to use a calculator to find the trig numbers. each function is listed below. 4.4 5 12.2 35.7
Answers: 2
You know the right answer?
The results of an analysis, on the makeup of garbage, done by the Environmental Protection Agency wa...
Questions

Social Studies, 20.09.2019 06:00
Mathematics, 20.09.2019 06:00


History, 20.09.2019 06:00


Chemistry, 20.09.2019 06:00


Computers and Technology, 20.09.2019 06:00

Geography, 20.09.2019 06:00
History, 20.09.2019 06:00


