
Mathematics, 24.05.2021 04:40 brodtfamily4
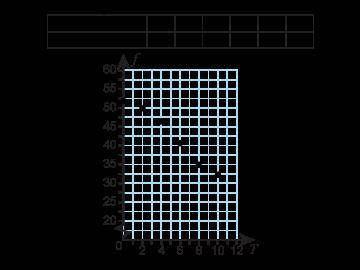
The temperature of a mixture in a chemistry lab was recorded every 2 minutes. The table and the scatter plot show the recorded data. Which equation represents a line of best fit for this data?
()=−2.14+53.4
()=−0.46+24.6
()=0.46+24.6
()=2.14+53.4

Answers: 1


Another question on Mathematics
Mathematics, 21.06.2019 18:00
What power can you write to represent the volume of the cube shown? write the power as an expression with a base and an exponent and then find the volume of the cube
Answers: 3
Mathematics, 21.06.2019 22:00
You're locked out of your house. the only open window is on the second floor, 25 feet above the ground. there are bushes along the edge of the house, so you will need to place the ladder 10 feet from the house. what length ladder do you need to reach the window?
Answers: 3
Mathematics, 22.06.2019 01:00
At a book fair, joe bought 24 books at 3 for $5 and had $2 left. how much money did he have at first?
Answers: 2
Mathematics, 22.06.2019 02:00
The deepest part of the swimming pool is 12 feet deep.the shallowest part of the pool is 3 feet deep.what is the ratio of the deeply of the deepest part of the pool to depth of the shallowest part of a pool?
Answers: 1
You know the right answer?
The temperature of a mixture in a chemistry lab was recorded every 2 minutes. The table and the scat...
Questions

English, 04.02.2020 01:55

Chemistry, 04.02.2020 01:55
Mathematics, 04.02.2020 01:55

Spanish, 04.02.2020 01:55

History, 04.02.2020 01:55
Mathematics, 04.02.2020 01:55


Advanced Placement (AP), 04.02.2020 01:55

Physics, 04.02.2020 01:55
English, 04.02.2020 01:55
Social Studies, 04.02.2020 01:55


Computers and Technology, 04.02.2020 01:55


