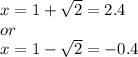
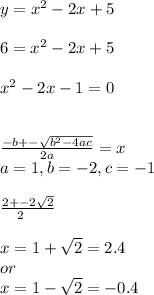
B) The graph of y = x2 – 2x + 5 is
drawn on the axes on the left.
Use the graph to estimate t...

Mathematics, 22.05.2021 16:30 vicbar1024
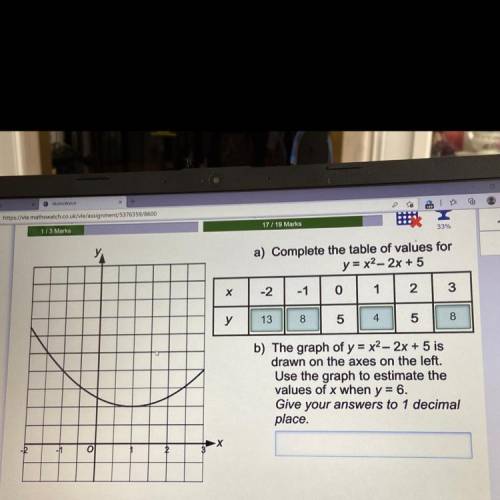
B) The graph of y = x2 – 2x + 5 is
drawn on the axes on the left.
Use the graph to estimate the
values of x when y = 6.
Give your answers to 1 decimal
place.
Please Help

Answers: 1


Another question on Mathematics
Mathematics, 20.06.2019 18:04
When benny’s sister penny is 24, benny’s age will be 125% of her age. how old is lenny? a) how old will benny be then? b)if benny is 12 years old now, how old is penny now? explain your reasoning.
Answers: 1
Mathematics, 21.06.2019 17:20
Which system of linear inequalities is represented by the graph? x-3y > 6 and y? 2x + 4 x + 3y > 6 and y? 2x - 4 x - 3y > 6 and y? 2 - 4 x + 3y > 6 and y > 2x + 4 no be 2 -1.1 1 2 3 4 5 submit save and exit next mark this and retum be
Answers: 1
Mathematics, 21.06.2019 18:50
Find the center and the radius of the circle with the equation: x^2-2x+y^2+4y+1=0?
Answers: 1
Mathematics, 22.06.2019 02:00
Reading tests are compared for two students. sara got 98, 100, 65, 78, 98, 46, 100, 100, 45, and 50 on her reading test. lee got 97, 67, 89, 99, 100, 45, 79, 89, 58, and 67 on his reading test.
Answers: 1
You know the right answer?
Questions
Mathematics, 11.02.2020 20:03


Social Studies, 11.02.2020 20:03


Mathematics, 11.02.2020 20:03
Mathematics, 11.02.2020 20:03
Mathematics, 11.02.2020 20:03
Mathematics, 11.02.2020 20:03


