
Mathematics, 21.05.2021 23:30 791197
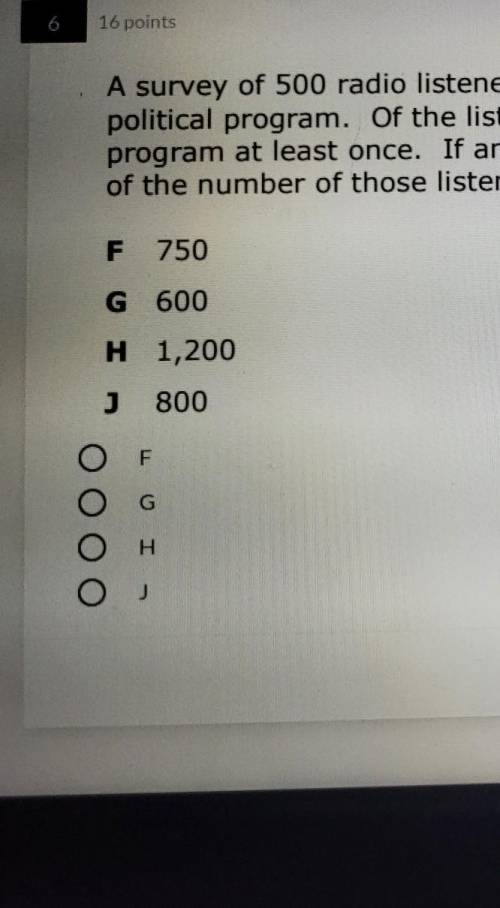
A survey of 500 radio listeners was conducted to find the number who listened to a weekly political program. Of the listeners surveyed, 120 said that they had listened to the political program at least once. If an additional 2,500 listeners are surveyed, which is the best prediction of the number of those listeners who have listened to the political program at least once?

Answers: 3


Another question on Mathematics
Mathematics, 21.06.2019 17:00
Suppose i flip two identical coins. what is the probability that i get one head and one tail?
Answers: 2
Mathematics, 21.06.2019 19:00
D(5, 7). e(4,3), and f(8, 2) form the vertices of a triangle. what is mzdef? oa. 30° ob. 45° oc. 60° od 90°
Answers: 1
Mathematics, 21.06.2019 22:00
After a dreary day of rain, the sun peeks through the clouds and a rainbow forms. you notice the rainbow is the shape of a parabola. the equation for this parabola is y = -x2 + 36. graph of a parabola opening down at the vertex 0 comma 36 crossing the x–axis at negative 6 comma 0 and 6 comma 0. in the distance, an airplane is taking off. as it ascends during take-off, it makes a slanted line that cuts through the rainbow at two points. create a table of at least four values for the function that includes two points of intersection between the airplane and the rainbow. analyze the two functions. answer the following reflection questions in complete sentences. what is the domain and range of the rainbow? explain what the domain and range represent. do all of the values make sense in this situation? why or why not? what are the x- and y-intercepts of the rainbow? explain what each intercept represents. is the linear function you created with your table positive or negative? explain. what are the solutions or solution to the system of equations created? explain what it or they represent. create your own piecewise function with at least two functions. explain, using complete sentences, the steps for graphing the function. graph the function by hand or using a graphing software of your choice (remember to submit the graph).
Answers: 2
Mathematics, 22.06.2019 04:20
1. suppose that scores on a knowledge test are normally distributed with a mean of 71 and a standard deviation of 6. a. label the curve: show the mean and the value at each standard deviation: b. if angelica scored a 76 on the test, what is her z-score? (draw her score on the curve above and label) c. what percent of students did angelica score higher than? how can you tell? d. if 185 students took the test, how many students scored higher than angelica?
Answers: 3
You know the right answer?
A survey of 500 radio listeners was conducted to find the number who listened to a weekly political...
Questions

Law, 02.05.2021 01:00

English, 02.05.2021 01:00
English, 02.05.2021 01:00

Mathematics, 02.05.2021 01:00


History, 02.05.2021 01:00
Mathematics, 02.05.2021 01:00


Mathematics, 02.05.2021 01:00


