
Mathematics, 17.05.2021 17:50 statonglenda
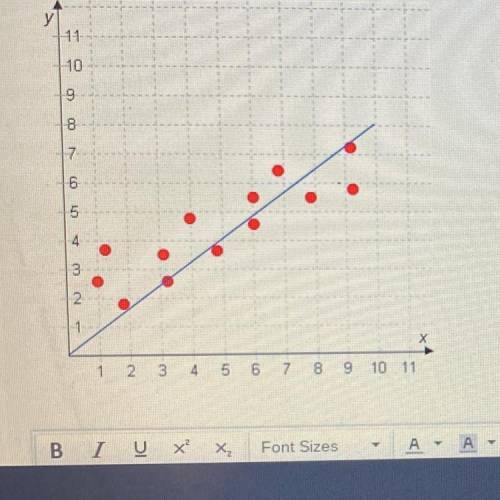
The line drawn for a scatter plot may not always be the line of best fit. But you can change it to a line of best fit by adjusting its y-intercept and
slope. In this activity, you will change lines to better fit the data.
Part A
How could you change the slope and the y-intercept of the line in this graph to better fit the data? (Hint: Visualize what the best fit line would look
like, and then describe how to transform the existing line to that one.)

Answers: 3


Another question on Mathematics
Mathematics, 21.06.2019 19:00
To solve the system of equations below, pedro isolated the variable y in the first equation and then substituted it into the second equation. what was the resulting equation? { 5y=10x {x^2+y^2=36
Answers: 1
Mathematics, 21.06.2019 23:00
Which rectangle if translated 6 units right and 16 units down and the rotated 90° clockwise about the point (4, -11) will result in rectangle e?
Answers: 2
You know the right answer?
The line drawn for a scatter plot may not always be the line of best fit. But you can change it to a...
Questions

Mathematics, 13.10.2019 12:00

Mathematics, 13.10.2019 12:00

History, 13.10.2019 12:00
Mathematics, 13.10.2019 12:00
History, 13.10.2019 12:00

Chemistry, 13.10.2019 12:00


