Select all points from the list below that lie
in the solution set of the system of
inequalit...

Mathematics, 13.05.2021 18:20 lexxa58
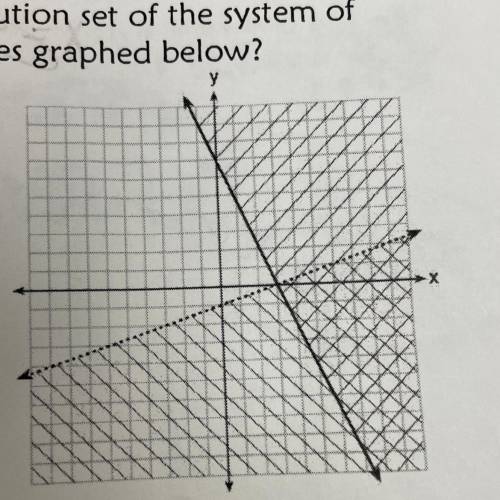
Select all points from the list below that lie
in the solution set of the system of
inequalities graphed below?
A. (7,0)
B. (3,0)
C. (0,7)
D. (-3,-5)
E. (9,-3)
F. (0,-1)

Answers: 1


Another question on Mathematics
Mathematics, 21.06.2019 21:30
Name and describe the three most important measures of central tendency. choose the correct answer below. a. the mean, sample size, and mode are the most important measures of central tendency. the mean of a data set is the sum of the observations divided by the middle value in its ordered list. the sample size of a data set is the number of observations. the mode of a data set is its highest value in its ordered list. b. the sample size, median, and mode are the most important measures of central tendency. the sample size of a data set is the difference between the highest value and lowest value in its ordered list. the median of a data set is its most frequently occurring value. the mode of a data set is sum of the observations divided by the number of observations. c. the mean, median, and mode are the most important measures of central tendency. the mean of a data set is the product of the observations divided by the number of observations. the median of a data set is the lowest value in its ordered list. the mode of a data set is its least frequently occurring value. d. the mean, median, and mode are the most important measures of central tendency. the mean of a data set is its arithmetic average. the median of a data set is the middle value in its ordered list. the mode of a data set is its most frequently occurring value.
Answers: 3
Mathematics, 21.06.2019 22:00
The mean finish time was 185.52 with a standard deviation of 0.327 minute. the winning car driven by chris finished in 185.13. the previous year race had a mean finish time of 110.3 with a standard deviation of 0.106. the winning car that year driven by karen finished in 110.13 minutes. find their respective z-scores. chris - z-score karen “- z-score
Answers: 1
Mathematics, 21.06.2019 23:30
Select the correct answer from each drop-down menu. james needs to clock a minimum of 9 hours per day at work. the data set records his daily work hours, which vary between 9 hours and 12 hours, for a certain number of days. {9, 9.5, 10, 10.5, 10.5, 11, 11, 11.5, 11.5, 11.5, 12, 12}. the median number of hours james worked is . the skew of the distribution is
Answers: 3
You know the right answer?
Questions


English, 26.02.2020 00:14

Computers and Technology, 26.02.2020 00:15

English, 26.02.2020 00:15


