
Mathematics, 13.05.2021 07:40 chychy2003
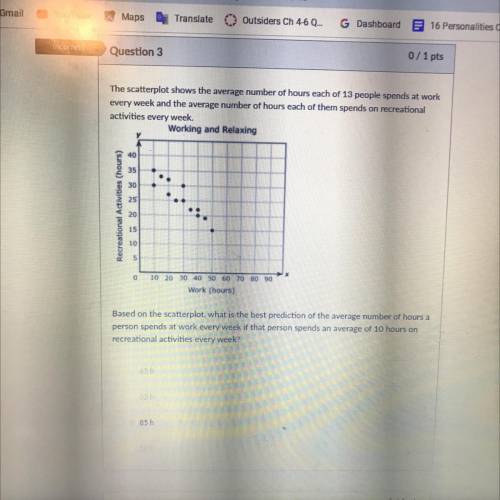
The scatterplot shows the average number of hours each of 13 people spends at work
every week and the average number of hours each of them spends on recreational
activities every week.
Working and Relaxing
40
30
Recreational Activities (hours)
20
15
10
0 10 20 30 40 50 60 70 80 90
Work (hours)
Based on the scatterplot, what is the best prediction of the average number of hours a
person spends at work every week if that person spends an average of 10 hours on
recreational activities every week?

Answers: 3


Another question on Mathematics
Mathematics, 21.06.2019 14:10
1. during first 10 seconds 2. between 10 seconds and 35 seconds 3. during 35 seconds to 40 seconds
Answers: 1
Mathematics, 21.06.2019 20:30
Ateam has p points. p = 3w + d w = wins d = draws a) a football team has 5 wins and 3 draws. how many points does the team have?
Answers: 1
Mathematics, 21.06.2019 21:20
Paul’s car is 18 feet long. he is making a model of his car that is 1/6 the actual size. what is the length of the model?
Answers: 1
Mathematics, 21.06.2019 22:00
Set $r$ is a set of rectangles such that (1) only the grid points shown here are used as vertices, (2) all sides are vertical or horizontal and (3) no two rectangles in the set are congruent. if $r$ contains the maximum possible number of rectangles given these conditions, what fraction of the rectangles in set $r$ are squares? express your answer as a common fraction.
Answers: 1
You know the right answer?
The scatterplot shows the average number of hours each of 13 people spends at work
every week and t...
Questions
Mathematics, 20.11.2020 06:30
Mathematics, 20.11.2020 06:30

Social Studies, 20.11.2020 06:30


Geography, 20.11.2020 06:30
Biology, 20.11.2020 06:30

Business, 20.11.2020 06:30


Business, 20.11.2020 06:30

English, 20.11.2020 06:30
Social Studies, 20.11.2020 06:30

Law, 20.11.2020 06:30
English, 20.11.2020 06:30


