
Mathematics, 13.05.2021 07:10 RogueDragon707
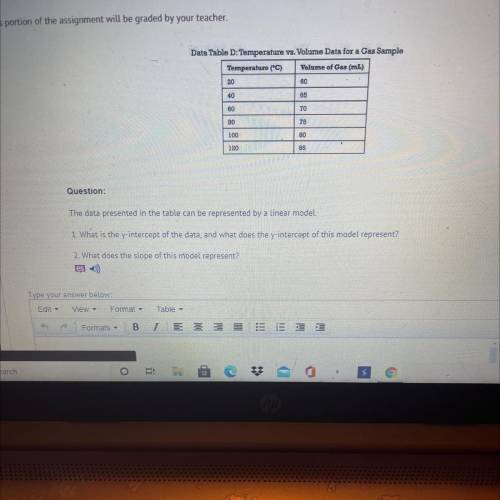
Data Table D: Temperature vs. Volume Data for a Gas Sample
Temperature (°C) Volume of Gas (mL)
20
60
40
65
60
70
80
75
100
80
120
85
Question:
The data presented in the table can be represented by a linear model.
1. What is the y-intercept of the data and what does the y-intercept of this model represent?
2. What does the slope of this model represent?

Answers: 1


Another question on Mathematics
Mathematics, 21.06.2019 13:10
Which system of linear inequalites is represented by the graph?
Answers: 1
Mathematics, 21.06.2019 22:30
The dash figure is a dilation if the original figure. find the scale factor. classify the dilation as an enlargement or a reduction
Answers: 2
Mathematics, 22.06.2019 00:00
If (x + 8) is a factor of f(x), which of the following must be true? both x = –8 and x = 8 are roots of f(x). neither x = –8 nor x = 8 is a root of f(x). f(–8) = 0 f(8) = 0
Answers: 3
Mathematics, 22.06.2019 00:00
4. bob solved the inequality problem below incorrectly. explain his error and redo the problem showing the correct answer. −2x + 5 < 17 −2x + 5-5 < 17-5 -2x/-2 < 12/-2 x < -6
Answers: 2
You know the right answer?
Data Table D: Temperature vs. Volume Data for a Gas Sample
Temperature (°C) Volume of Gas (mL)
Questions


English, 10.07.2019 16:00


Social Studies, 10.07.2019 16:00
Mathematics, 10.07.2019 16:00
Biology, 10.07.2019 16:00
Mathematics, 10.07.2019 16:00
History, 10.07.2019 16:00
Mathematics, 10.07.2019 16:00
History, 10.07.2019 16:00

English, 10.07.2019 16:00
Mathematics, 10.07.2019 16:00


