
Mathematics, 12.05.2021 22:00 maltbie1283
WILL GIVE BRAINLIEST
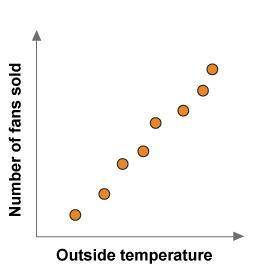
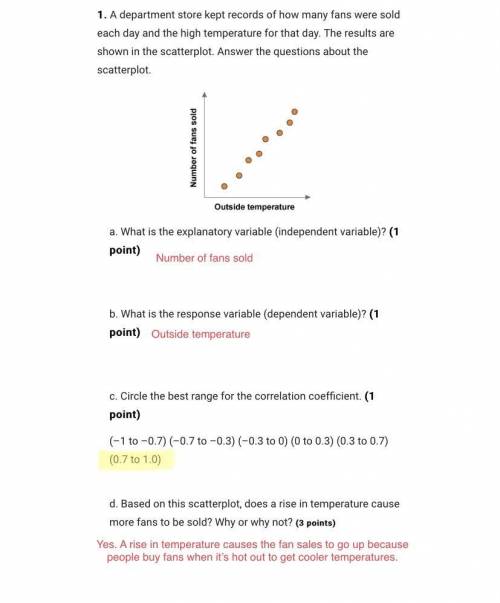
1. A department store kept records of how many fans were sold each day and the high temperature for that day. The results are shown in the scatterplot. Answer the questions about the scatterplot.
a. What is the explanatory variable (independent variable)? (1 point)
b. What is the response variable (dependent variable)? (1 point)
c. Circle the best range for the correlation coefficient. (1 point)
(–1 to –0.7) (–0.7 to –0.3) (–0.3 to 0) (0 to 0.3) (0.3 to 0.7) (0.7 to 1.0)
d. Based on this scatterplot, does a rise in temperature cause more fans to be sold? Why or why not? (3 points)
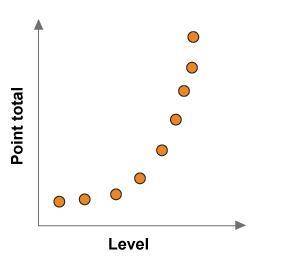
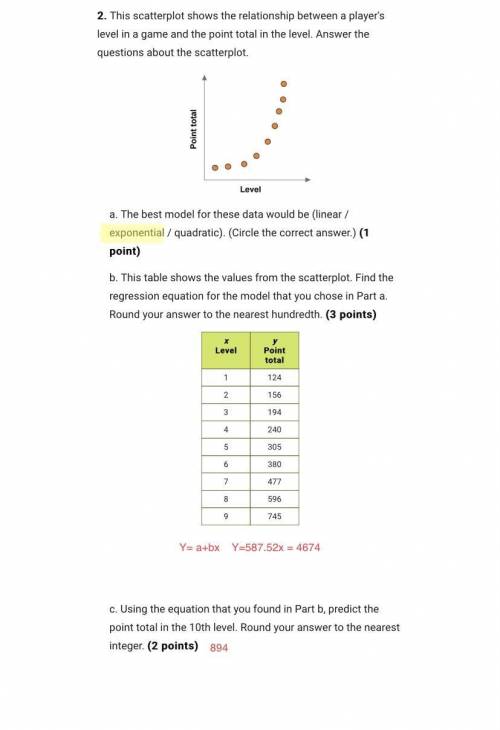
2. This scatterplot shows the relationship between a player's level in a game and the point total in the level. Answer the questions about the scatterplot.
a. The best model for these data would be (linear / exponential / quadratic). (Circle the correct answer.) (1 point)
b. This table shows the values from the scatterplot. Find the regression equation for the model that you chose in Part a. Round your answer to the nearest hundredth. (3 points)
x
Level
y
Point total
1
124
2
156
3
194
4
240
5
305
6
380
7
477
8
596
9
745
c. Using the equation that you found in Part b, predict the point total in the 10th level. Round your answer to the nearest integer. (2 points)
3. Maria is a veterinarian. She wants to know how the weight of a puppy is related to its length. To find out, Maria randomly selected 10 puppies that are two months old. She recorded the length and weight of each puppy in the table below.
Part A. The data from the table are shown on the scatterplot. Draw an estimated line of best fit through the data points. (3 points)
Part B. Use the scatterplot to answer these questions.
a. What kind of correlation exists between the length and weight of the puppies? Explain. (2 points)
b. Identify two points on the line of best fit that you drew in Part A. Use the two points to find the equation of the line. Write the equation of the best fit line in slope-intercept form. Show your work. (4 points: 1 point for identifying the coordinates of two points, 1 point for slope, 1 point for b-value, and 1 point for showing work)
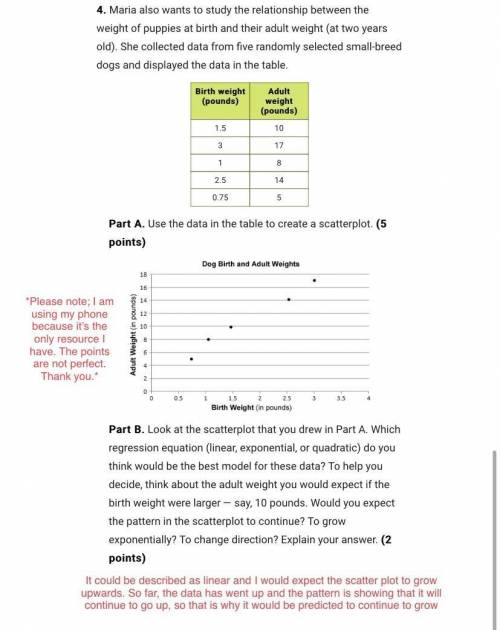
4. Maria also wants to study the relationship between the weight of puppies at birth and their adult weight (at two years old). She collected data from five randomly selected small-breed dogs and displayed the data in the table.
Birth weight
(pounds)
Adult weight
(pounds)
1.5
10
3
17
1
8
2.5
14
0.75
5
Part A. Use the data in the table to create a scatterplot. (5 points)
Part B. Look at the scatterplot that you drew in Part A. Which regression equation (linear, exponential, or quadratic) do you think would be the best model for these data? To help you decide, think about the adult weight you would expect if the birth weight were larger — say, 10 pounds. Would you expect the pattern in the scatterplot to continue? To grow exponentially? To change direction? Explain your answer. (2 points)
Part C. Perform a linear regression and interpret the results.
a. Use a calculator to perform a linear regression. Round the values your calculator gives you for a and b to the nearest hundredth. (2 points)
y = _x + _
b. What is the slope of the regression equation? What does this mean in terms of the birth weight and adult weight? (2 points)
c. What is the value of the correlation coefficient? (1 point)
d. Describe the correlation in terms of strength (weak or strong) and direction (positive or negative). (2 points)
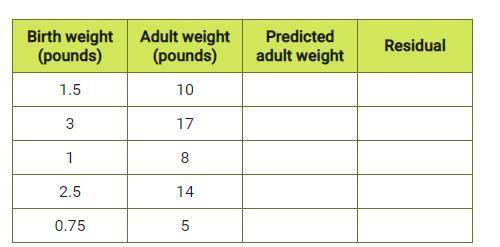
Part D. Analyze the residuals.
Birth weight
(pounds)
Adult weight
(pounds)
Predicted
adult weight
Residual
1.5
10
3
17
1
8
2.5
14
0.75
5
a. Use the linear regression equation from Part C to calculate the predicted adult weight for each birth weight. Round to the nearest hundredth. Enter these in the third column of the table. (2.5 points)
b. Find the residual for each birth weight. Round to the nearest hundredth. Enter these in the fourth column of the table. (2.5 points)
c. Plot the residuals. (3 points)
d. Based on the residuals, is your regression line a reasonable model for the data? Why or why not? (2 points)
5. Decide whether each statement is true or false. (1 point each)
a. T/F: If there is a strong correlation between two variables, the correlation coefficient will be close to –1 or 1.
b. T/F: If there is a negative correlation between two variables, the slope of the regression line will be positive.
c. T/F: If there is a strong correlation between two variables, there is a cause-and-effect relationship.
d. T/F: The best model for data that change direction is a linear model.
e. T/F: A regression line is useful for predicting unknown values within the range of the observed data values.

Answers: 2


Another question on Mathematics
Mathematics, 21.06.2019 17:40
Follow these steps using the algebra tiles to solve the equation −5x + (−2) = −2x + 4. 1. add 5 positive x-tiles to both sides and create zero pairs. 2. add 4 negative unit tiles to both sides and create zero pairs. 3. divide the unit tiles evenly among the x-tiles. x =
Answers: 1
Mathematics, 21.06.2019 18:30
The volume of gas a balloon can hold varies directly as the cube of its radius. imagine a balloon with a radius of 3 inches can hold 81 cubic inches of gas. how many cubic inches of gas must be released to reduce the radius down to 2 inches?
Answers: 2
Mathematics, 21.06.2019 19:00
How does a low unemployment rate affect a nation's economy? a. the nation has a higher number of productive resources. b. the nation can spend more money on for unemployed people. c. the nation can save money by paying lower salaries to a large workforce. reset
Answers: 1
Mathematics, 21.06.2019 19:30
Atemperature of 1.64◦f corresponds to answer in units of ◦c.
Answers: 1
You know the right answer?
WILL GIVE BRAINLIEST
1. A department store kept records of how many fans were sold each day and the...
Questions
Mathematics, 17.05.2021 03:50

French, 17.05.2021 03:50

Mathematics, 17.05.2021 03:50

English, 17.05.2021 03:50
Mathematics, 17.05.2021 03:50

History, 17.05.2021 03:50


Mathematics, 17.05.2021 03:50
Mathematics, 17.05.2021 03:50
Mathematics, 17.05.2021 03:50


