Family Budget
We
Utilities
20%
The circle graph below shows the percentages of a...

Mathematics, 07.05.2021 21:50 phamleson8697
Family Budget
We
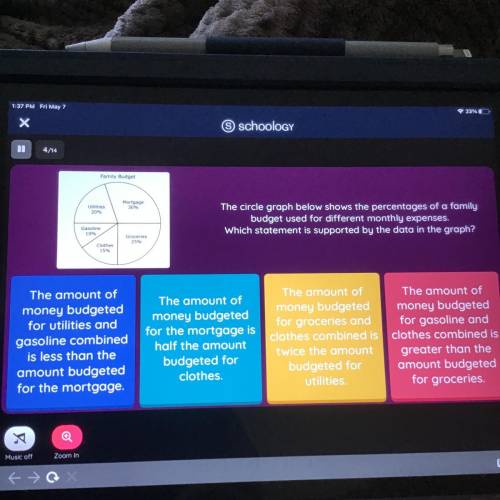
Utilities
20%
The circle graph below shows the percentages of a family
budget used for different monthly expenses.
Which statement is supported by the data in the graph?
Gasoline
10%
Groceries
25%
Clothes
15%
The amount of
money budgeted
for utilities and
gasoline combined
is less than the
amount budgeted
for the mortgage.
The amount of
money budgeted
for the mortgage is
half the amount
budgeted for
clothes
The amount of The amount of
money budgeted money budgeted
for groceries and for gasoline and
clothes combined is clothes combined is
twice the amount greater than the
budgeted for amount budgeted
utilities
for groceries.

Answers: 1


Another question on Mathematics
Mathematics, 21.06.2019 16:30
Data are collected to see how many ice-cream cones are sold at a ballpark in a week. day 1 is sunday and day 7 is the following saturday. use the data from the table to create a scatter plot.
Answers: 3
Mathematics, 21.06.2019 19:00
The diagonals of a quadrilaretral intersect at (-1,4). one of the sides of the quadrilateral is bounded by (2,7) and (-3,5) determine the coordinates of the other side in order for the quadrilaretral to be a square.
Answers: 1
Mathematics, 21.06.2019 19:30
Combine the information in the problem and the chart using the average balance method to solve the problem.
Answers: 2
You know the right answer?
Questions


Health, 20.10.2020 04:01

History, 20.10.2020 04:01


Biology, 20.10.2020 04:01

Business, 20.10.2020 04:01
History, 20.10.2020 04:01


English, 20.10.2020 04:01
History, 20.10.2020 04:01
Health, 20.10.2020 04:01


