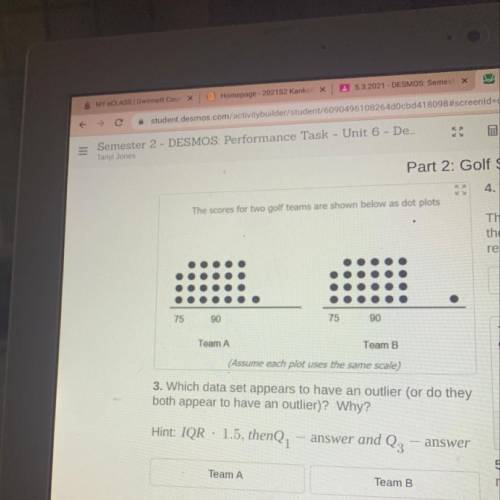
The scores for two golf teams are shown below as dot plots
75
90
75
90
Tea...

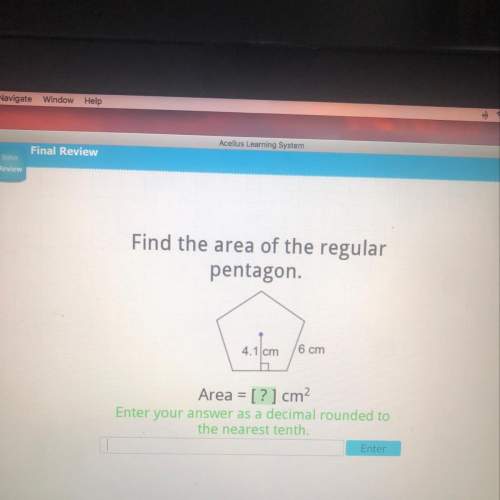
Mathematics, 04.05.2021 03:00 ldpozorski
The scores for two golf teams are shown below as dot plots
75
90
75
90
Team A
Team B
(Assume each plot uses the same scale)
3. Which data set appears to have an outlier (or do they
both appear to have an outlier)? Why?
Hint: IQR · 1.5, thenQ, – answer and Qz – answer
PLEASE HELP ME AND HURRY

Answers: 2


Another question on Mathematics
Mathematics, 21.06.2019 12:50
In the final round of trivia competition, contestants were asked to name as many states that begin with the letter m as they could in 15 seconds. the bar graph shows the number of states the contestants were able to name. how many contestants participated in the final round of the competition?
Answers: 2
Mathematics, 22.06.2019 02:00
Write the component forms of vectors u and v, shown in the graph, and find v − 2u. u= (< -3, -2> , < -3, -1> , < -2, -2> , < -2, -1> ) v= (< -5, 1> , -4, 0> , < 0, -4> , < 1, -5> ) v-2u= (< 5, 3> , < 0, 4> , < 4, 0> , < 5, -3>
Answers: 3
You know the right answer?
Questions


English, 04.12.2021 04:00

Mathematics, 04.12.2021 04:00
English, 04.12.2021 04:00
History, 04.12.2021 04:00


Chemistry, 04.12.2021 04:00
Physics, 04.12.2021 04:00
Mathematics, 04.12.2021 04:00


