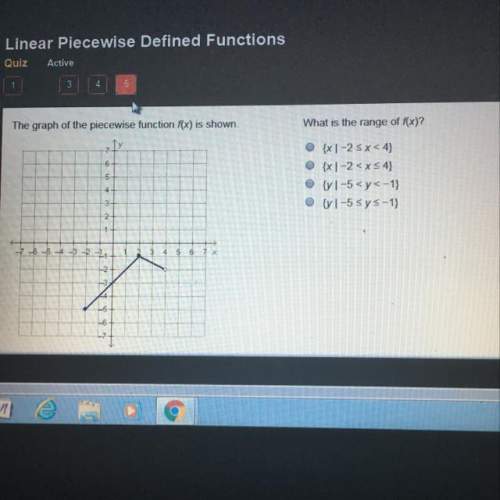
the range of a function is the range of y-values for which it is defined, or exists. given that we are only looking at the y-values, we can already discount the first two answers as they deal with the domain of the function (range of x-values).
now, what we need to do is find the smallest and highest y-values for which the function is defined. if you'd like, you could take a ruler and start at the very bottom of the graph, find the lowest point, then move the ruler higher and higher until you reach the highest point. doing so either in your head or with an actual ruler, we can see that the lowest y-value is -5 and the highest y-value is -1.
the question now remains as to whether they are included in the range (fourth answer) or excluded (third answer). the key here is to recognise whether they are marked with an open or a closed circle. since both (-2, -5) and (2, -1) are marked with a closed circle, they are points that exist on the graph and are thus included in the range (note that if they were marked with an open circle like (4, -2) then that would signify that there is a break in the graph at that point).
thus, the fourth answer, (y | -5 ≤ y ≤ -1), is correct.
also note that usually it is good practice to scan your eye inbetween the highest and lowest point for any breaks in the graph - we do have one here at (4, -2), however -2 is still included in the range because there is another point that is included in the graph with the same y-value, ie. point (1, -2).
i hope that but if you require any further explanation don't hesitate to comment below.