
Mathematics, 01.05.2021 03:50 becky6962
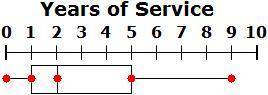
After a company celebrated its ten year anniversary, the president of the company wanted to know how long employees have been with the company. Human resources provided the president with the box plot below.
Using the box plot, determine the best measures of the data.
The best measure of center is the (blank)
, and the best measure of variability is the (blank)
.
The number that best summarizes the data is (blank)
years of service.
The number that best describes how the data varies is (blank)
years of service.

Answers: 2


Another question on Mathematics
Mathematics, 21.06.2019 20:40
The graph of a function f(x)=(x+2)(x-4). which describes all of the values for which the graph is negative and increasing? all real values of x where x< -2 all real values of x where -2
Answers: 2
Mathematics, 21.06.2019 22:30
Which expressions equal 9 when x=4 and y=1/3 a. x2+6y b. 2x + 3y c. y2-21x d. 5 (x/2) -3y e. 3x-9y
Answers: 2
Mathematics, 22.06.2019 01:00
Multiply: 2.7 × (–3) × (–1.2). a. –9.72 b. –10.8 c. 10.8 d. 9.72
Answers: 2
You know the right answer?
After a company celebrated its ten year anniversary, the president of the company wanted to know how...
Questions

Mathematics, 06.05.2021 19:20
Mathematics, 06.05.2021 19:20

Biology, 06.05.2021 19:20

English, 06.05.2021 19:20
Mathematics, 06.05.2021 19:20
Mathematics, 06.05.2021 19:20

Physics, 06.05.2021 19:20

Biology, 06.05.2021 19:20
Mathematics, 06.05.2021 19:20


