Mathematics, 30.04.2021 17:30 kenrick99
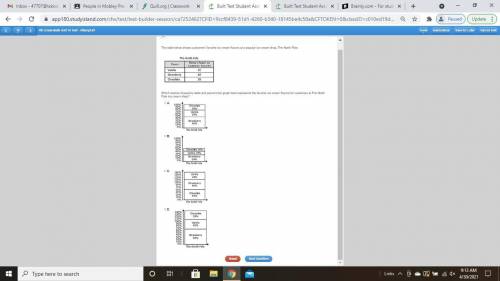
I know it small but can someone help me. It says The table below shows customers' favorite ice cream flavors at a popular ice cream shop, The North Pole. Which relative frequency table and percent bar graph best represents the favorite ice cream flavors for customers at The North Pole ice cream shop?


Answers: 1


Another question on Mathematics

Mathematics, 21.06.2019 20:30
Three numbers x, y, and z are in the ratio 2: 7: 8. if 12 is subtracted from y, then three numbers form a geometric sequence (in the order x, y–12, z). find x, y, and z. there are 2 sets.
Answers: 1

Mathematics, 21.06.2019 21:50
Which of the following is the graph of y= square root -x-3
Answers: 1

Mathematics, 22.06.2019 00:10
Me its important ! marge runs an ice cream parlor. her speciality is triple chocolate sundaes.she can prepare 1 sundae every 2 minutes, and she earns $1.20 for each sundae she makes . if she just makes sundaes for a single shift of at most 4 hours and at least 2 hours , which function relates her earnings to the number of minutes she works?
Answers: 2

Mathematics, 22.06.2019 01:30
Urgent need asap △abc is similar to △xyz. also, side ab measures 6 cm, side bc measures 18 cm, and side xy measures 12 cm. what is the measure of side yz ? enter your answer in the box.
Answers: 1
You know the right answer?
I know it small but can someone help me. It says The table below shows customers' favorite ice cream...
Questions

Mathematics, 06.10.2019 22:20

English, 06.10.2019 22:20

Mathematics, 06.10.2019 22:20

English, 06.10.2019 22:20

Mathematics, 06.10.2019 22:20

History, 06.10.2019 22:20

History, 06.10.2019 22:20


Arts, 06.10.2019 22:30

Chemistry, 06.10.2019 22:30


Physics, 06.10.2019 22:30


Mathematics, 06.10.2019 22:30


Mathematics, 06.10.2019 22:30

Mathematics, 06.10.2019 22:30

Mathematics, 06.10.2019 22:30


