
Mathematics, 29.04.2021 22:30 denaemarie02
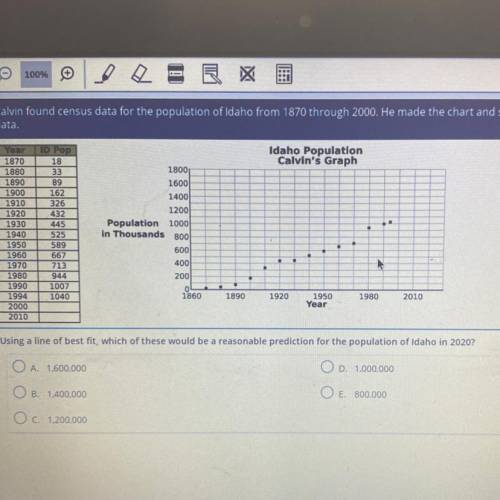
Calvin found census data for the population of Idaho from 1870 through 2000. He made the chart and scatter plot using this
data.
Idaho Population
Calvin's Graph
Yaar
1870
1880
1890
1900
1910
1920
1930
1940
1950
1960
1970
1980
1990
1994
2000
2010
TID Pop
18
33
89
162
326
432
445
525
589
667
713
944
1007
1040
1800
1600)
1400
1200
Population 1000
in Thousands 800
600
400
200
OL
1860
1890
1920
1950
Year
1980
2010
Using a line of best fit, which of these would be a reasonable prediction for the population of Idaho in 2020?
O A 1.600.000
O D. 1,000,000
O B. 1,400,000
O E. 800.000
O c. 1.200.000

Answers: 2


Another question on Mathematics
Mathematics, 21.06.2019 20:00
How can you construct perpendicular lines and prove theorems about perpendicular lines
Answers: 3
Mathematics, 21.06.2019 22:30
What is the least common multiple for 6 and 8? what is the least common multiple for 4 and 12 ? what is the least common multiple for 11 and 12? what is the least common multiple for 3 and 6?
Answers: 1
Mathematics, 22.06.2019 02:00
Bag a contains 3 white marveled and 2 marbles bag b contains 6 white marbles and 3 red marbles a person draws one marbles from each bag find the probability that both marbles are white
Answers: 1
You know the right answer?
Calvin found census data for the population of Idaho from 1870 through 2000. He made the chart and s...
Questions


English, 10.06.2021 04:40

World Languages, 10.06.2021 04:40
Mathematics, 10.06.2021 04:40
Mathematics, 10.06.2021 04:40
Mathematics, 10.06.2021 04:40
Mathematics, 10.06.2021 04:40
History, 10.06.2021 04:40
Mathematics, 10.06.2021 04:40


