
Mathematics, 29.04.2021 19:00 dhruvi62
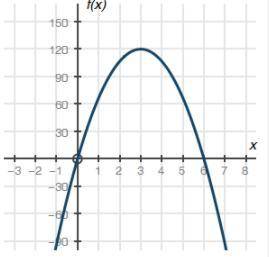
The graph below shows a company's profit f(x), in dollars, depending on the price of pens x, in dollars, sold by the company:
Graph of quadratic function f of x having x intercepts at ordered pairs 0, 0 and 6, 0. The vertex is at 3, 120.
Part A: What do the x-intercepts and maximum value of the graph represent? What are the intervals where the function is increasing and decreasing, and what do they represent about the sale and profit? (4 points)
Part B: What is an approximate average rate of change of the graph from x = 3 to x = 5, and what does this rate represent? (3 points)
Part C: Describe the constraints of the domain. (3 points)

Answers: 3


Another question on Mathematics
Mathematics, 21.06.2019 18:00
In the xy-plane, if the parabola with equation passes through the point (-1, -1), which of the following must be true?
Answers: 3
Mathematics, 21.06.2019 22:10
In which direction does the left side of the graph of this function point? f(x) = 3x3 - x2 + 4x - 2
Answers: 2
Mathematics, 22.06.2019 01:00
The balance of susu's savings account can be represented by the variable b. the inequality describing her balance b > $30 . which could be a solution to the inequality?
Answers: 2
You know the right answer?
The graph below shows a company's profit f(x), in dollars, depending on the price of pens x, in doll...
Questions
Mathematics, 07.12.2020 09:30

English, 07.12.2020 09:30

Mathematics, 07.12.2020 09:30
Biology, 07.12.2020 09:30

Mathematics, 07.12.2020 09:40
Mathematics, 07.12.2020 09:40
English, 07.12.2020 09:40
English, 07.12.2020 09:40
Mathematics, 07.12.2020 09:40
Mathematics, 07.12.2020 09:40

Spanish, 07.12.2020 09:40
Mathematics, 07.12.2020 09:40


