
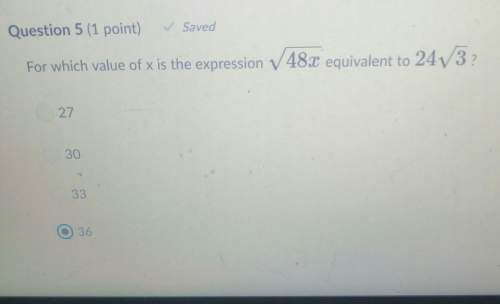
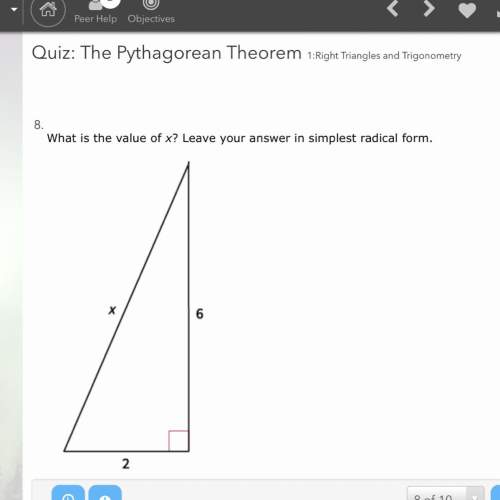
Mathematics, 29.04.2021 01:50 avahrider1
A group of 17 students participated in a quiz competition. Their scores are shown below:
Score 0–4 5–9 10–14 15–19 20–24
Number of students 4 5 2 3 3
Part A: Would a dot plot, a histogram, or a box plot best represent the data shown above. Explain your answer. (4 points)
Part B: Provide a step-by-step description of how you would create the graph named in Part A. (6 points)

Answers: 3


Another question on Mathematics
Mathematics, 21.06.2019 14:10
Which linear equations have an infinite number of solutions? check all that apply. (x – 3/7) = 2/7(3/2x – 9/14)8(x + 2) = 5x – 1412.3x – 18 = 3(–6 + 4.1x)(6x + 10) = 7(x – 2)4.2x – 3.5 = 2.1 (5x + 8)
Answers: 3
Mathematics, 21.06.2019 14:30
An eight-sided die, which may or may not be a fair die, has four colors on it; you have been tossing the die for an hour and have recorded the color rolled for each toss. what is the probability you will roll a brown on your next toss of the die? express your answer as a simplified fraction or a decimal rounded to four decimal places.
Answers: 2
Mathematics, 21.06.2019 17:00
Explain how you do each step what term makes it inconsistent y=2x - 4 ?
Answers: 1
Mathematics, 21.06.2019 21:30
You dug a hole that was 8 feet deep. after taking a short break, you dug down 3 more feet in the same hole. when finished digging, a tractor accidentally filled the hole with 4 feet of dirt. how deep is your hole now?
Answers: 2
You know the right answer?
A group of 17 students participated in a quiz competition. Their scores are shown below:
Score 0–4...
Questions
Mathematics, 04.10.2021 06:10

Spanish, 04.10.2021 06:10
Mathematics, 04.10.2021 06:10


Mathematics, 04.10.2021 06:10


Biology, 04.10.2021 06:10
Mathematics, 04.10.2021 06:10

Chemistry, 04.10.2021 06:10
Mathematics, 04.10.2021 06:10
Mathematics, 04.10.2021 06:10
Chemistry, 04.10.2021 06:10


