
Mathematics, 28.04.2021 22:30 nathangirnet
Scatter Plots
Laura went to a golf shop that has a golf simulator. The simulator estimates the distance that each ball she hits would have gone. She hit five balls each with her 2, 3, 4, 5, 6, 7, 8, and 9 irons. The distances of her golf shots are given in the table. Keep this table window open as you work on the tasks in this activity.
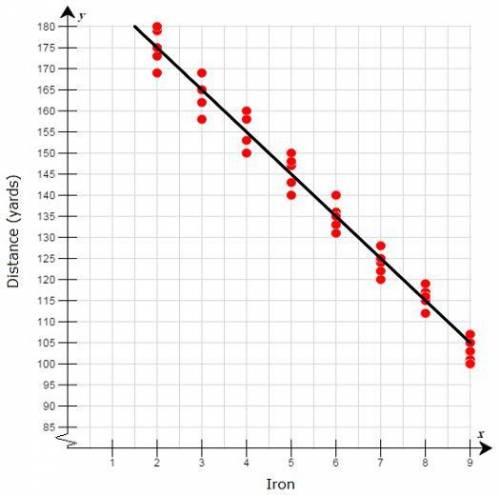
When Laura graphed the data, she got this scatter plot and drew a line of best fit. Keep the scatter plot window open as you work on the tasks in this activity.
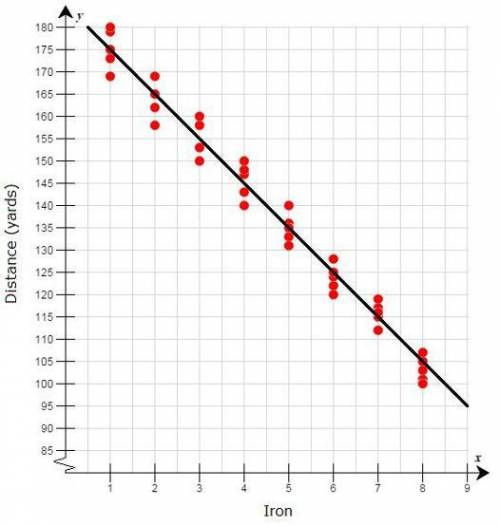
When her brother graphed the data, he got a different scatter plot and drew a line of best fit. Keep the scatter plot window open as you work on the tasks in this activity.
Part A
Whose scatter plot matches the data, and what is wrong with the incorrect scatter plot?
Part B
Using the correct graph, describe the association shown.
Part C
What is the slope of the line in the correct graph? What is the slope of the line in the incorrect graph? Are the slopes the same or different?
Part D
What is the y-intercept of the correct graph? What is the y-intercept of the incorrect graph? Are the y-intercepts the same?
Part E
If Laura were able to find a 0 iron, about how far could she hit it?
Part F
About what is the average change in distance for each increase of 1 in the iron number? What does this mean in terms of the situation?
The Table
Iron Distance Iron Distance Iron Distance
2 179 5 150 8 119
2 169 5 147 8 115
2 173 5 148 8 112
2 175 5 140 8 117
2 180 5 143 8 116
3 158 6 136 9 105
3 169 6 140 9 108
3 165 6 135 9 100
3 162 6 131 9 101
3 165 6 133 9 103
4 153 7 128
4 158 7 124
4 153 7 120
4 160 7 122
4 150 7 125

Answers: 2


Another question on Mathematics
Mathematics, 21.06.2019 16:00
Write two subtraction equations that are equivalent to 5 + 12 = 17.
Answers: 2
Mathematics, 21.06.2019 18:00
What is the value of x in the equation (2)3) (x+6)= -18 a. -36 b. -33 c. -24 d. -18
Answers: 1
Mathematics, 21.06.2019 23:40
The frequency table shows the results of a survey asking people how many hours they spend online per week. on a piece of paper, draw a histogram to represent the data. then determine which answer choice matches the histogram you drew. in order here is the.. hours online: 0-3, 4-7, 8-11, 12-15, and 16-19. frequency: 5, 8, 10, 8, 7 answer for the question is in the picture! : )
Answers: 2
Mathematics, 22.06.2019 00:00
Asequence is a function whose is the set of natural numbers
Answers: 1
You know the right answer?
Scatter Plots
Laura went to a golf shop that has a golf simulator. The simulator estimates the dis...
Questions
Mathematics, 03.06.2021 22:30


English, 03.06.2021 22:30
Mathematics, 03.06.2021 22:30

Mathematics, 03.06.2021 22:30


English, 03.06.2021 22:30
Mathematics, 03.06.2021 22:30
English, 03.06.2021 22:30


