
Mathematics, 26.04.2021 05:50 kxngtj3
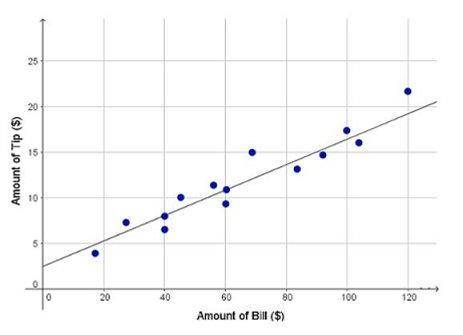
The graph shows the tip amount that 14 different customers left, based on their bill. A trend line has been drawn for the data. The equation for the line is: y = 0.14x + 2.5. Which BEST interprets the slope of the linear model?
A) A $1 increase in the bill is associated with a $2.50 increase in tip amount.
B) A $2.50 increase in the bill is associated with a $1 increase in tip amount.
C) A $0.14 increase in the bill is associated with a $1 increase in tip amount.
D) A $1 increase in the bill is associated with a $0.14 increase in tip amount.
The answer is D

Answers: 3


Another question on Mathematics
Mathematics, 21.06.2019 13:20
Hello i need some with trigonometric substitutions. [tex]\int\limits^a_b {x} \, dx[/tex]
Answers: 3
Mathematics, 21.06.2019 21:10
See attachment below and find the equivalent of tan(∠qsr)
Answers: 3
Mathematics, 21.06.2019 23:00
The areas of two similar triangles are 72dm2 and 50dm2. the sum of their perimeters is 226dm. what is the perimeter of each of these triangles?
Answers: 1
Mathematics, 22.06.2019 00:30
Asalsa recipe uses green pepper, onion, and tomato in the extended ratio 3: 5: 7. how many cups of tomato are needed to make 105 cups of salsa? a. 7 b. 21 c. 35 d. 49
Answers: 3
You know the right answer?
The graph shows the tip amount that 14 different customers left, based on their bill. A trend line h...
Questions
Mathematics, 21.02.2020 01:14


Mathematics, 21.02.2020 01:14


Mathematics, 21.02.2020 01:14

Health, 21.02.2020 01:14


Computers and Technology, 21.02.2020 01:15


