
Mathematics, 20.04.2021 18:10 alliehall2002
Help
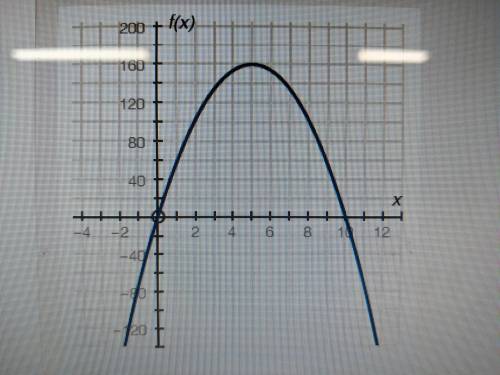
The graph below shows a company's profit f(x), in dollars, depending on the price of pencils x, in dollars, sold by the company:
Part A: What do the x-intercepts and maximum value of the graph represent? What are the intervals where the function is increasing and decreasing, and what do they represent about the sale and profit? (4 points)
Part B: What is an approximate average rate of change of the graph from x = 2 to x = 5, and what does this rate represent? (3 points)
Part C: Describe the constraints of the domain. (3 points)

Answers: 3


Another question on Mathematics
Mathematics, 21.06.2019 18:10
Jordan has $5.37, which he is using to buy ingredients to make salsa. he is buying one red pepper for $1.29 and three pounds of tomatoes. if jordan has exactly the right amount of money he needs, what is the price per pound of the tomatoes? choose the correct equation to represent this real-world problem. solve the equation and verify the reasonableness of your answer. a pound of tomatoes costs .
Answers: 1
Mathematics, 21.06.2019 19:20
Which letters from the table represent like terms? a and b b and c a and d b and d
Answers: 3
Mathematics, 21.06.2019 22:00
What is the solution to the equation e3x=12? round your answer to the nearest hundredth
Answers: 1
Mathematics, 22.06.2019 00:40
Astock has a 25% probability of increasing by $10 and a 75% probability of decreasing by $5. what is the stocks expected increase or decrease?
Answers: 1
You know the right answer?
Help
The graph below shows a company's profit f(x), in dollars, depending on the price of pencils...
Questions


History, 25.12.2019 09:31

Social Studies, 25.12.2019 09:31


Arts, 25.12.2019 09:31
Mathematics, 25.12.2019 09:31
English, 25.12.2019 09:31
Social Studies, 25.12.2019 09:31
Mathematics, 25.12.2019 09:31


