45 points and !
the graph below shows the height of a kicked soccer ball f(x), in feet, depen...

Mathematics, 14.10.2019 04:00 fymdes2001
45 points and !
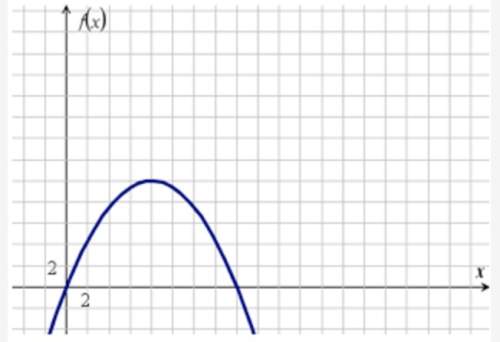
the graph below shows the height of a kicked soccer ball f(x), in feet, depending on the distance from the kicker x, in feet:
part a: what do the x-intercepts and maximum value of the graph represent? what are the intervals where the function is increasing and decreasing, and what do they represent about the distance and height? (6 points)
part b: what is an approximate average rate of change of the graph from x = 8 to x = 13, and what does this rate represent? (4 points)

Answers: 2


Another question on Mathematics
Mathematics, 21.06.2019 13:10
When eating out, record the total cost of your meal (before tip) and the tip that you left. determine the percent of the cost of the meal that you left as a tip.
Answers: 1
Mathematics, 21.06.2019 15:20
Find the image of a(4, -2) after it is reflected over the line y= 2, then reflected over the line x = 2. (-8,6) o (0.-2) o (0,6) (-8, -2)
Answers: 1
Mathematics, 21.06.2019 15:30
Question 7 of 47 1 point what is the equation of a line with a slope of 1/2 that passes through the point, (-2,5)? o a. 1/2x+3 o b. y=1/2x+5 o c. y=x+5 o d. y=1/2x+6
Answers: 3
Mathematics, 21.06.2019 20:30
Ming says that 0.24 > 1/4 because 0.24= 2/4. which best explains mings error
Answers: 1
You know the right answer?
Questions


Biology, 03.02.2022 14:00

English, 03.02.2022 14:00

Computers and Technology, 03.02.2022 14:00

Mathematics, 03.02.2022 14:00
Mathematics, 03.02.2022 14:00
Mathematics, 03.02.2022 14:00
Biology, 03.02.2022 14:00

Social Studies, 03.02.2022 14:00
English, 03.02.2022 14:00

Law, 03.02.2022 14:00


