which system of inequalities is represented by the graph?

Mathematics, 28.01.2020 01:31 cheesecake1919
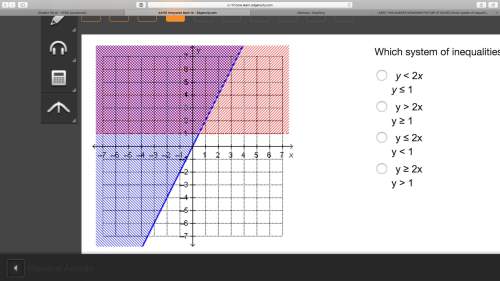
I'll choose a brainliest !
which system of inequalities is represented by the graph?
a.) y < 2x
y ≤ 1
b.) y > 2x
y ≥ 1
c.) y ≤ 2x
y < 1
d.) y ≥ 2x
y > 1

Answers: 3


Another question on Mathematics
Mathematics, 21.06.2019 14:00
The depth of a lake at a certain point, wich is a function of the distance of that point from shore, is 30 feet.
Answers: 1
Mathematics, 21.06.2019 19:00
Since opening night, attendance at play a has increased steadily, while attendance at play b first rose and then fell. equations modeling the daily attendance y at each play are shown below, where x is the number of days since opening night. on what day(s) was the attendance the same at both plays? what was the attendance? play a: y = 8x + 191 play b: y = -x^2 + 26x + 126 a. the attendance was never the same at both plays. b. the attendance was the same on day 5. the attendance was 231 at both plays on that day. c. the attendance was the same on day 13. the attendance was 295 at both plays on that day. d. the attendance was the same on days 5 and 13. the attendance at both plays on those days was 231 and 295 respectively.
Answers: 1
Mathematics, 21.06.2019 20:30
What is the axis of symmetry of the function f(x)=-(x+ 9)(x-21)
Answers: 2
Mathematics, 21.06.2019 23:30
(c) compare the results of parts (a) and (b). in general, how do you think the mode, median, and mean are affected when each data value in a set is multiplied by the same constant? multiplying each data value by the same constant c results in the mode, median, and mean increasing by a factor of c. multiplying each data value by the same constant c results in the mode, median, and mean remaining the same. multiplying each data value by the same constant c results in the mode, median, and mean decreasing by a factor of c. there is no distinct pattern when each data value is multiplied by the same constant. (d) suppose you have information about average heights of a random sample of airline passengers. the mode is 65 inches, the median is 72 inches, and the mean is 65 inches. to convert the data into centimeters, multiply each data value by 2.54. what are the values of the mode, median, and mean in centimeters? (enter your answers to two decimal places.) mode cm median cm mean cm in this problem, we explore the effect on the mean, median, and mode of multiplying each data value by the same number. consider the following data set 7, 7, 8, 11, 15. (a) compute the mode, median, and mean. (enter your answers to one (1) decimal places.) mean value = median = mode = (b) multiply 3 to each of the data values. compute the mode, median, and mean. (enter your answers to one (1) decimal places.) mean value = median = mode = --
Answers: 1
You know the right answer?
I'll choose a brainliest !
which system of inequalities is represented by the graph?
which system of inequalities is represented by the graph?
Questions


Biology, 14.10.2019 19:30

Social Studies, 14.10.2019 19:30


English, 14.10.2019 19:30
History, 14.10.2019 19:30

Physics, 14.10.2019 19:30
Mathematics, 14.10.2019 19:30
History, 14.10.2019 19:30


Chemistry, 14.10.2019 19:30


